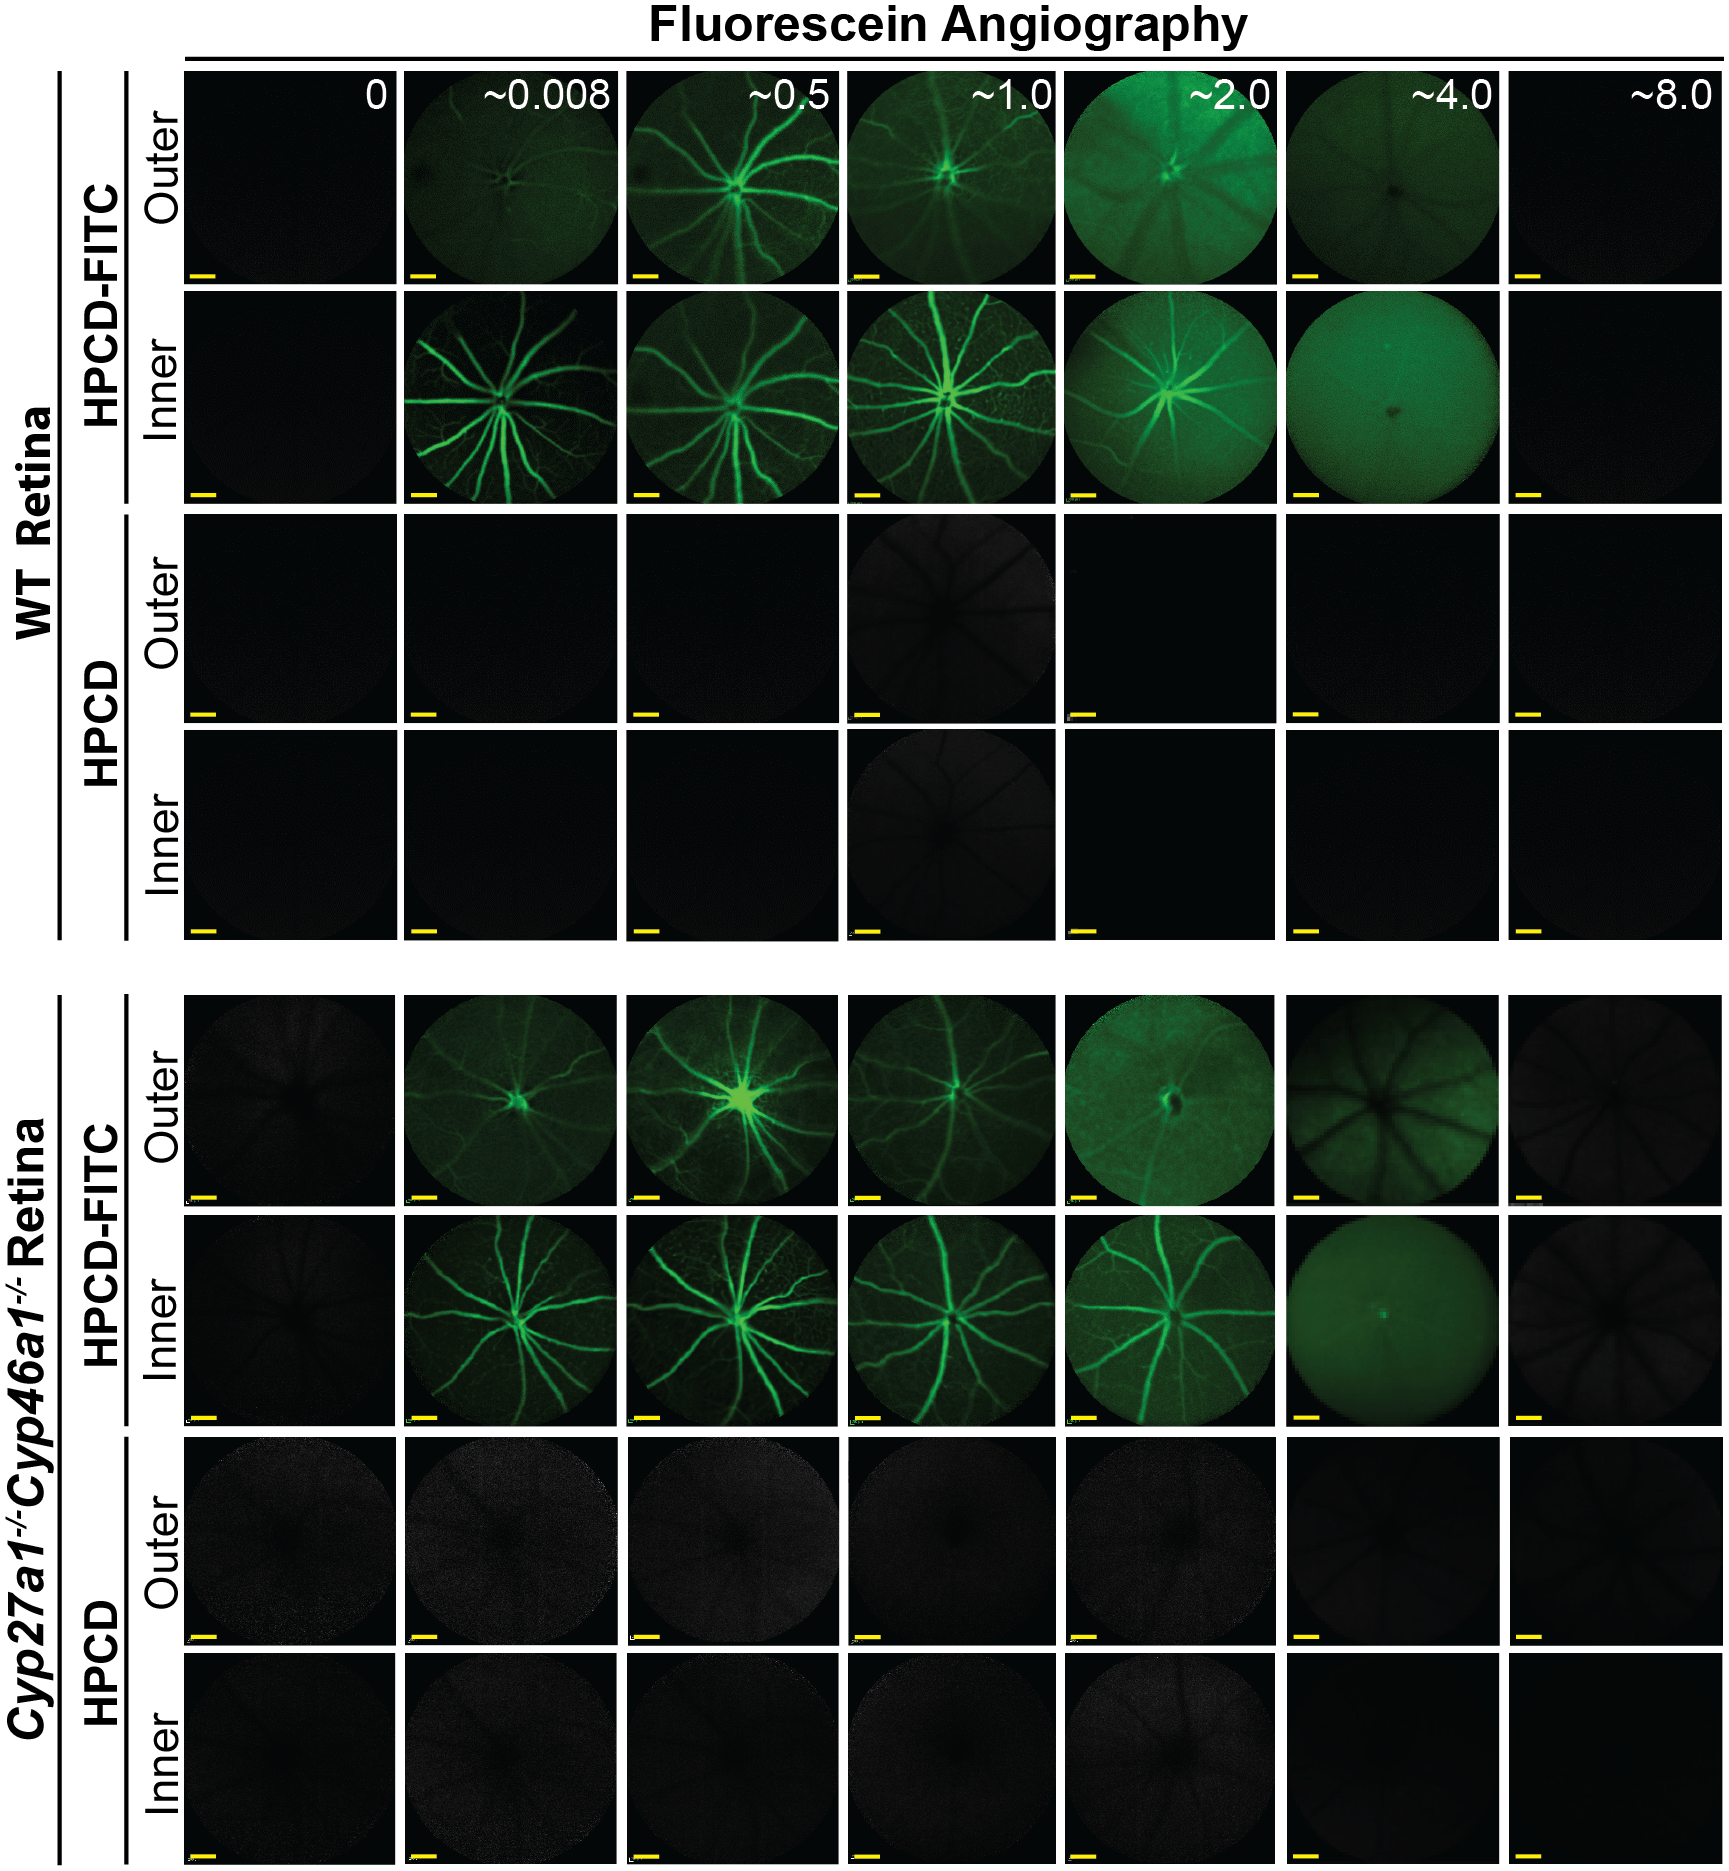
Figure 2.

Fluorescein angiography (55° field of view) of mice injected i.p. either with HPCD or HPCD-FITC. The laser beam was first focused on the outer and then inner retina to assess the two distinct vascular networks, the choroidal and intraretinal, which nourish the outer and inner retina, respectively. Five female mice were used to collect the data for the 0–0.5-, 1-, 2-, 4-, and 8-hr post-injection time points; the post injection time (hr) is in white font on the upper panels. Scale bars: 100 μm.
