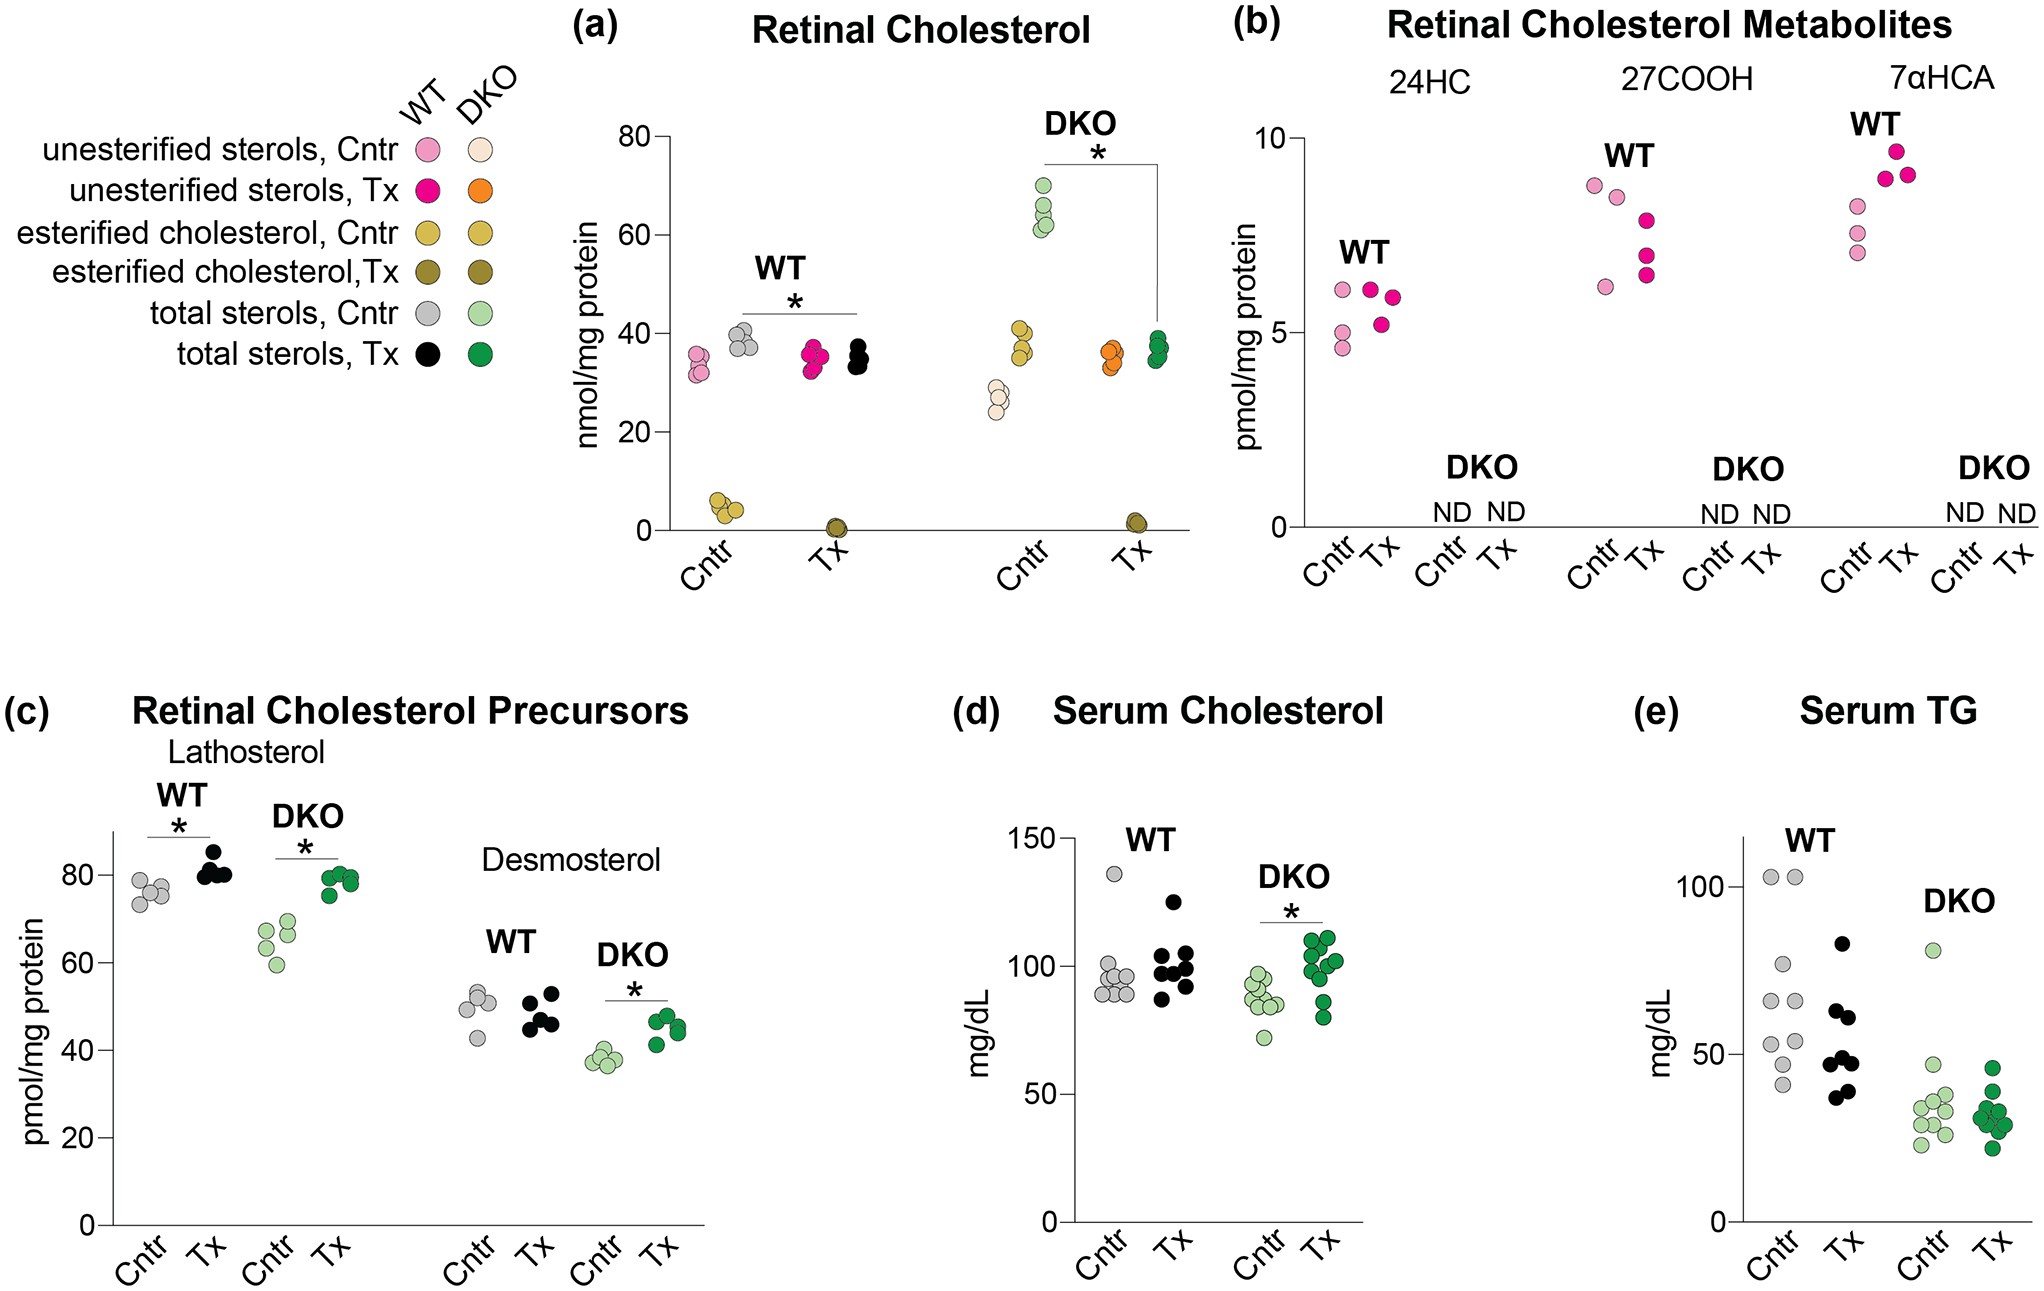
Figure 3.

HPCD treatment by oral gavage: effects on lipids. The HPCD dose was 1.6 g/kg BW and treatment duration was 11 days. (a-c) Sterols in the retina. The total sterol content is a sum of the esterified and unesterified sterol forms. (d, e) Lipids in the serum. (a) and (c-e) Each dot represents an individual measurement of a male retina; 5 mice in each group in (a) and (c) and 8–10 mice in each group in (d) and (e) were used. (b) Each dot represents a measurement of a pooled sample of 6 retinas from 6 male mice; a total of three pooled samples (18 mice) were used for each group. Statistical significance for changes in total sterol in HPCD-treated vs control mice in (a) and (c-e), was assessed by the Mann-Whitney U test and that in (b) was not assessed because of n=3. *P ≤ 0.05. 24HC, 24-hydroxycholesterol; 27COOH, 5-cholestenoic acid; 7αHCA, 7α-hydroxy-3-oxo-4-cholestenoic acid; Cntr, control mice; DKO, Cyp27a1−/−Cyp46a1−/− mice; ND, not detected; TG, triglycerides; Tx, HPCD-treated mice; WT, wild type mice;
