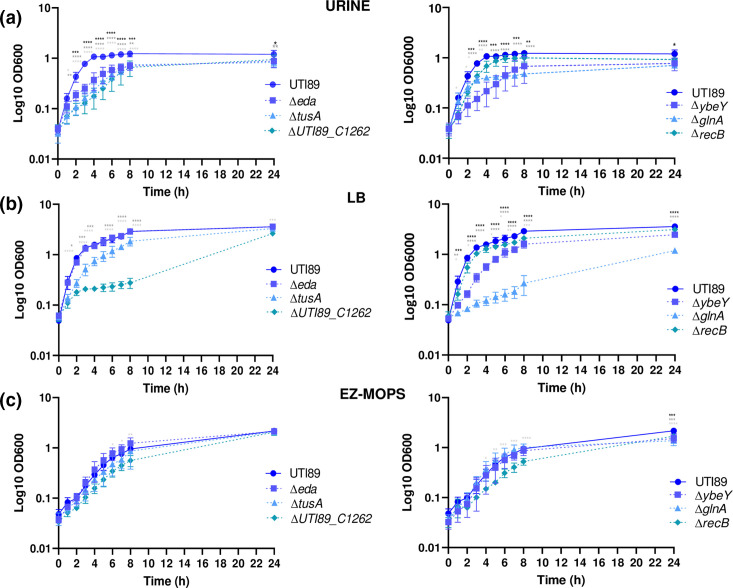
Fig. 5.
Growth curves obtained for E. coli UTI89 and its mutant derivatives in urine (a), LB (b) and EZ-MOPS (c). The data shown are means±standard deviations of three biological replicates. Statistical significance (****P < 0.0001; ***P < 0.001; **P < 0.01; *P < 0.05) was determined by one-sample t-test or ANOVA and Sidak’s post-test. Black, dark and light grey asterisks show significant differences between E. coli UTI89 and the mutants (∆eda or ∆ybeY, ∆tusA or ∆glnA and ∆UTI89_C1262 or ∆recB), respectively. Only results for validated genes in urine are shown.

