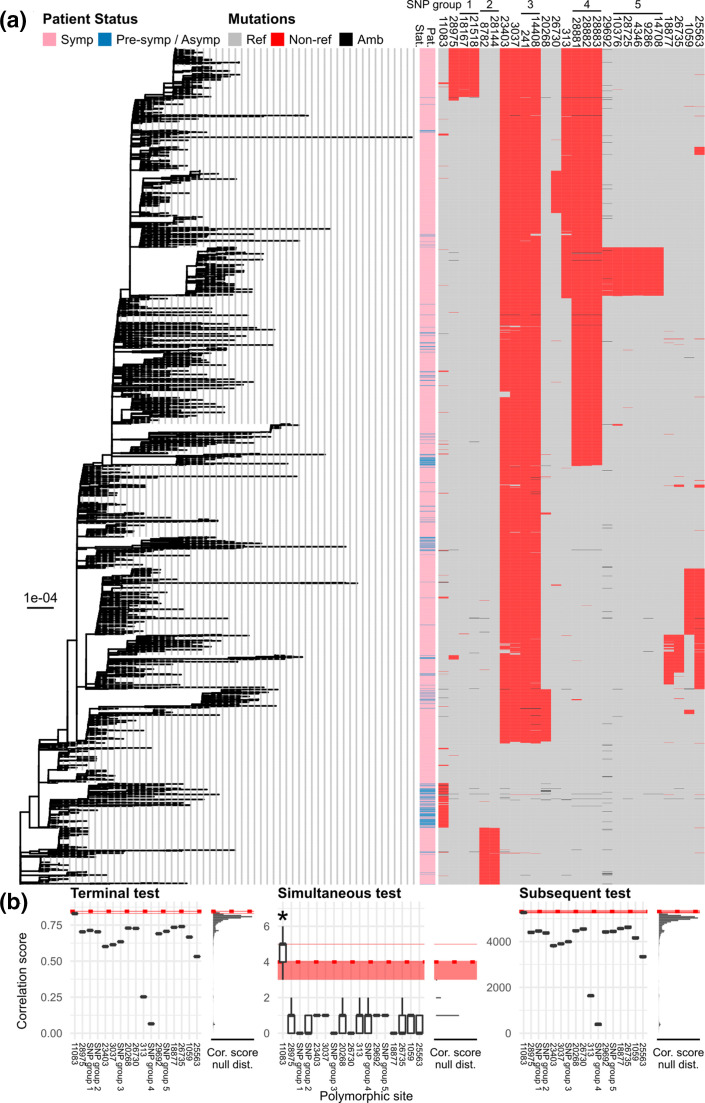
Fig. 2.
Screening for candidate sites with genetic variations associated with COVID-19 pathogenicity by using TreeWAS [29]. (a) Maximum-likelihood tree of SARS-CoV-2 (as shown in Fig. 1) is shown on the left. Bar, substitutions per site. The viruses’ patient status (pat. stat.) and mutational profiles of the 26 polymorphic sites investigated (Table 1) are shown on the right (see keys for details). Sites determined as strongly linked loci are indicated with black horizontal bars and numbers on the top. (b) Three separate tests of genotype–phenotype association implemented in the software TreeWAS [29] were performed, namely ‘Terminal’ (left), ‘Simultaneous’ (middle) and ‘Subsequent’ tests (right) with Bonferroni multiple-testing correction (adjusted P value threshold=5 %/17 sets of polymorphic sites analysed=0.294 %). To account for phylogenetic uncertainty, the tests were applied to the entire distribution of the 1000 bootstrap trees to obtain the distributions of correlation scores and null scores (Cor. score null dist.). The horizontal red strips indicate the 95 % highest density intervals of the score cut-offs obtained from the 1000 bootstrap analyses. The horizontal red dotted lines indicate the score cut-off obtained from the maximum-likelihood tree analysis. All tests revealed that site 11 083 had the highest scores (horizontal red solid lines). Simultaneous tests suggested that site 11 083 was the only site with genetic variations significantly associated with COVID-19 patient status (marked with an asterisk, positive bootstrap testing rate=58.5 %), while the other two tests did not detect significant signals.

