
Figure 6.
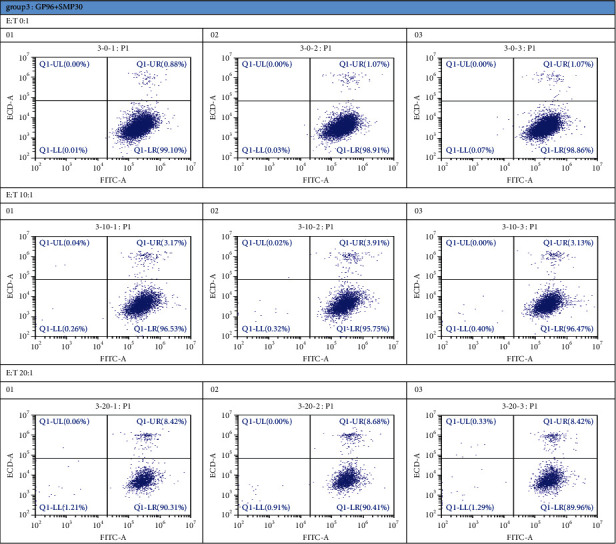
Detection of CTL killing of SMMC-7721 cells by FCM: each group was tested 3 times. The first quadrant represents the CTL effect. Group 3 was a mixed group, and the data indicated that it had a better CTL response than the single-treatment group (12.07%).