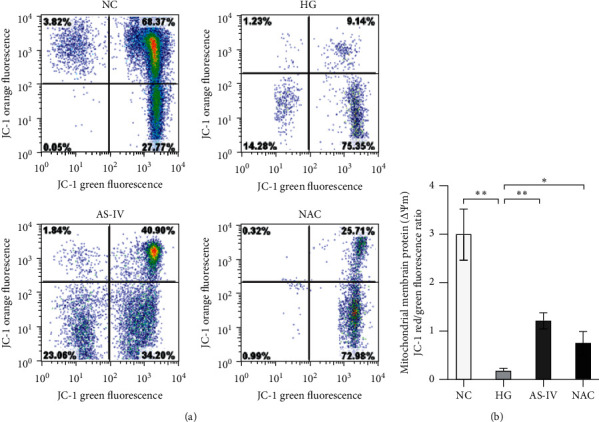
Figure 4.

(a) Flow cytometric measurement of mitochondrial membrane potential. (b) The results of MtMP. Data are presented as the mean ± SD of three independent experiments. Statistical significance: ∗p < 0.05; ∗∗p < 0.01.

(a) Flow cytometric measurement of mitochondrial membrane potential. (b) The results of MtMP. Data are presented as the mean ± SD of three independent experiments. Statistical significance: ∗p < 0.05; ∗∗p < 0.01.