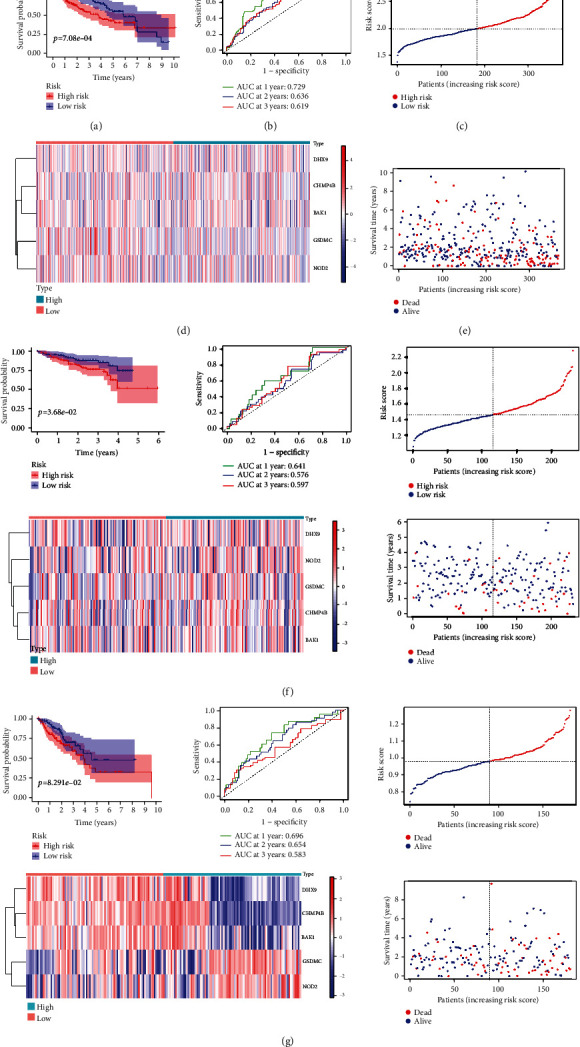
Figure 3.

Generation and validation of the signature. (a) K-M survival curve displays the OS of patients between different risk groups in TCGA cohort. (b) Time-dependent ROC curves of the patients in TCGA cohort. (c) Heat map illustrated the expression patterns of five PRGs in TCGA cohort. (d) Distribution of the risk score in TCGA cohort. (e) Survival status scatter plots of patients in TCGA cohort. (f) Survival analysis with respect to the ICGC cohort (n = 231). (g) Survival analysis of the FAHWMU cohort (n = 180).
