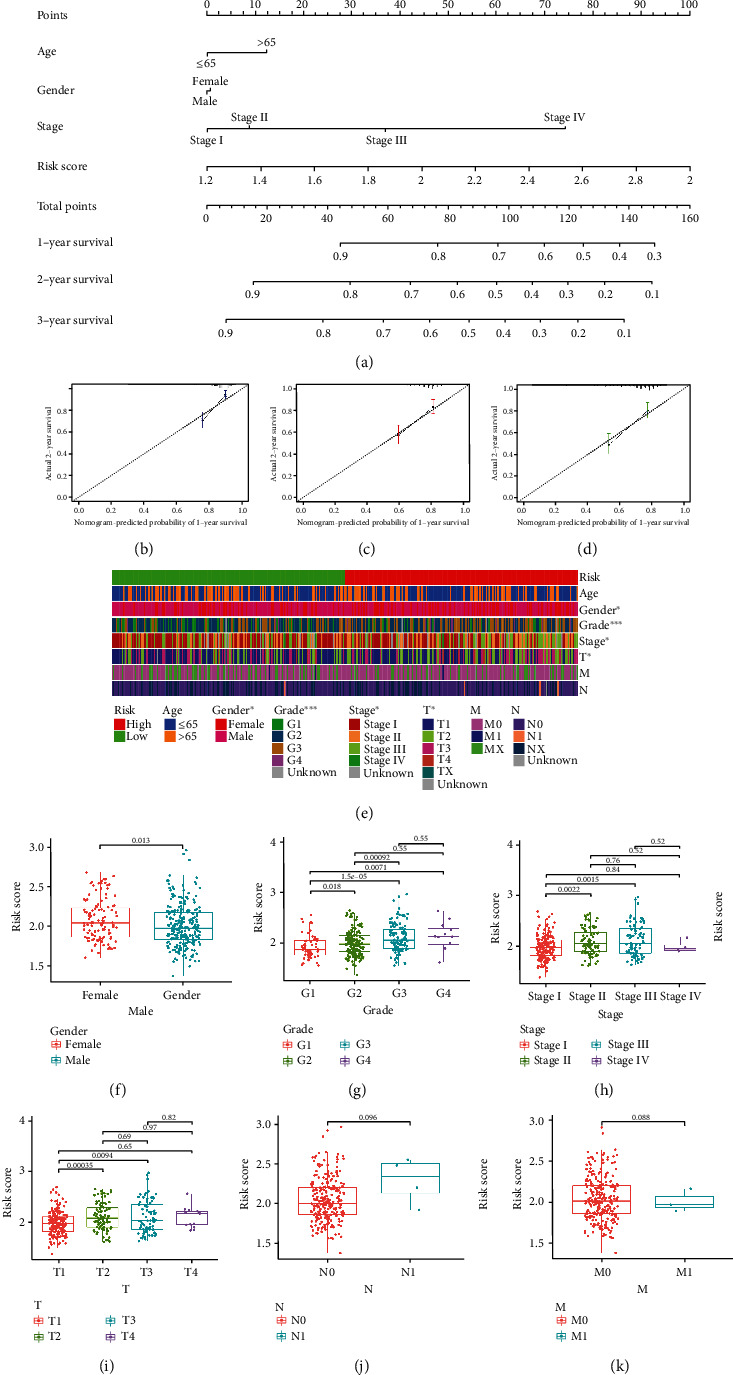
Figure 4.

Selection of the independent prognostic factors. (a) The nomogram of the risk score and clinical parameters (age, gender, and TNM stage) in TCGA cohort. (b–d) The calibration curves displayed the accuracy of the nomogram in the 1st, 2nd, and 3rd years. (e) Complex heat map illustrated the correlation between risk and clinical characteristics (∗P < 0.05, ∗∗P < 0.01, and ∗∗∗P < 0.001). (f–k) Boxplots demonstrated the differences in risk scores across clinical features (F: gender; G: grade; H: TNM stage; I: T stage; J: N stage; K: M stage).
