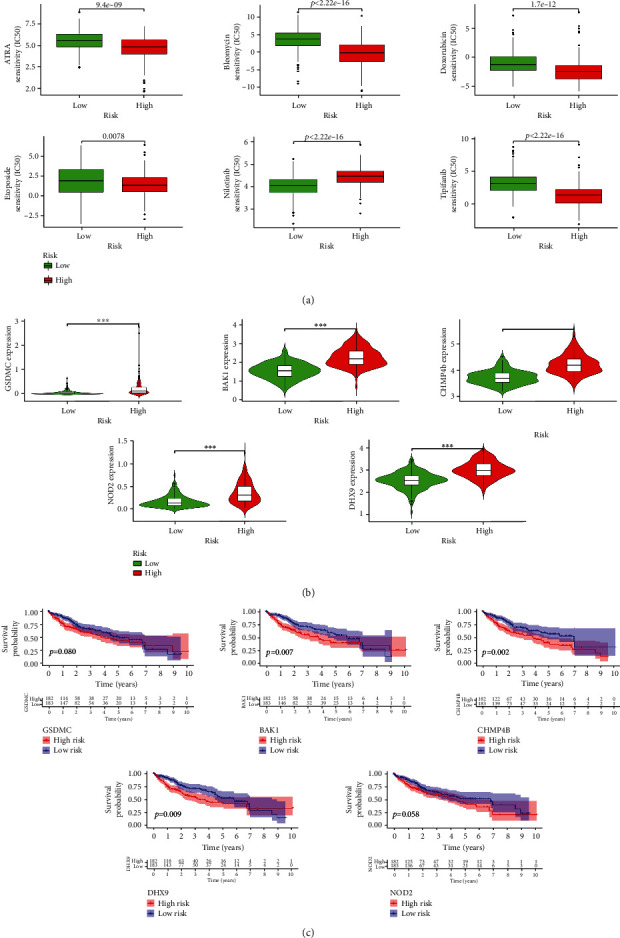
Figure 6.

Drug sensitivity of the signature. (a) Boxplots displayed the estimated IC50 of different potential drug sensitivity (ATRA, Bleomycin, Doxorubicin, Etoposide, Nilotinib, and Tipifarnib) between low- and high-risk groups (all P < 0.05). (b) Violin plots presented significant differences in the expression of individual genes across the signature in high- and low-risk groups (∗∗∗P < 0.001). (c) K-M survival curves illustrated that the lower expression of individual genes across signature had better OS (P < 0.1).
