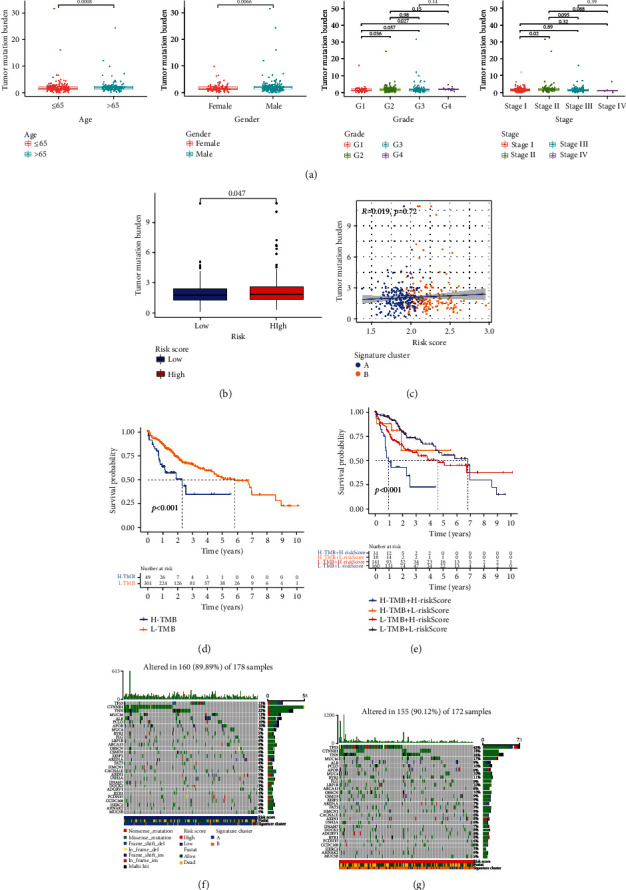
Figure 8.

Tumor mutation burden analyses. (a) Boxplots showed the differences in TMB value among different clinical characteristics (age: P = 0.0008, gender: P = 0.0066, and G1-G4: P = 0.027). (b) Boxplot illustrated that the TMB value was significantly higher in the high-risk group (P = 0.047). (c) Scatter plot of correlations between the TMB value and the risk score. (d) K-M survival curve of the high-TMB group and the low-TMB group. (e) K-M survival curve of the comprehensive analyses between TMB and risk score. (f) Comparison of mutation frequencies in the low-risk group. (g) Comparison of mutation frequencies in the high-risk group.
