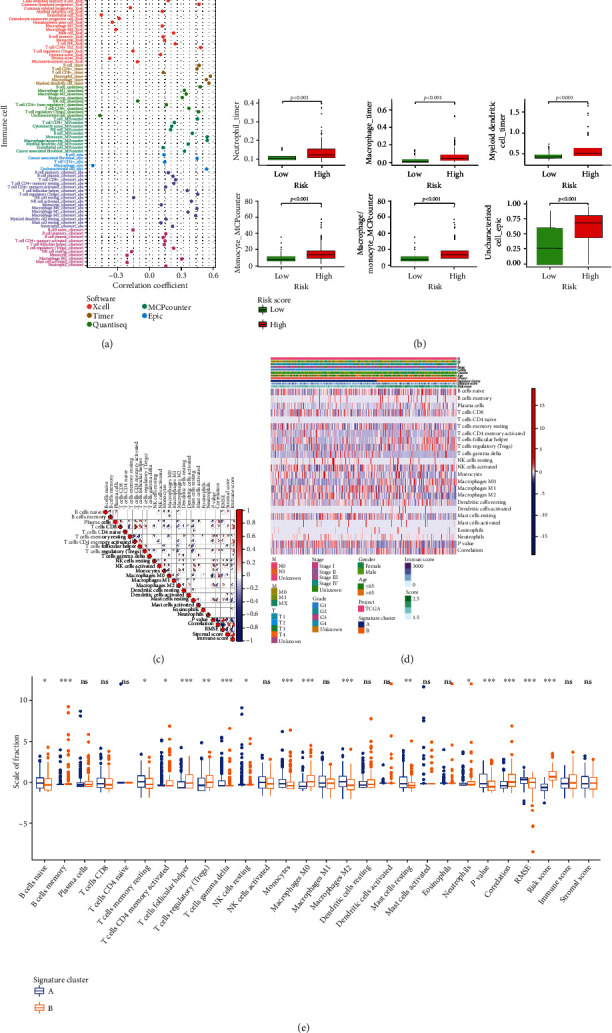
Figure 9.

Immune correlation analyses and immune differential analyses of three clusters in the HCC patients. (a) Correlation coefficients between different immune cells and risk score. (b) Boxplots showed the content of immune cells with high correlation coefficients is significantly higher in the high-risk group. (c) The correlation plot of immune cells in TCGA cohort. (d) Complex heat map displayed the association between the expression levels of immune cells and clinical features in the HCC patients. (e) The differential analyses between immune cells and the scale of fraction for cluster A and cluster B.
