Figure 2.
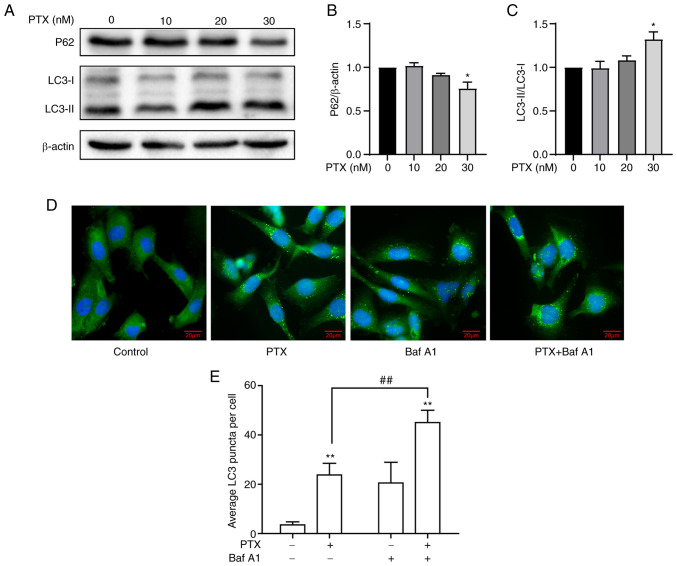
PTX induces autophagy in MDA-MB-231 cells. (A) Protein expression levels of the autophagy markers P62, LC3-I and LC3-II at different doses of PTX. β-actin was used as an internal control. The semi-quantification of (B) P62 (*P<0.05 vs. 0 nM PTX), and (C) LC3-II/LC3-I protein expression (*P<0.05 vs. 0 nM PTX). (D) Representative images of LC3 puncta. Cells were stained with antibodies against LC3 (green), and nuclei were stained with DAPI (blue). Scale bar, 20 µm. (E) Quantification of LC3 puncta (**P<0.01 vs. 0 nM PTX; ##P<0.01 vs. 20 nM PTX). PTX, paclitaxel; LC3, light chain 3; Baf A1, bafilomycin A1.

