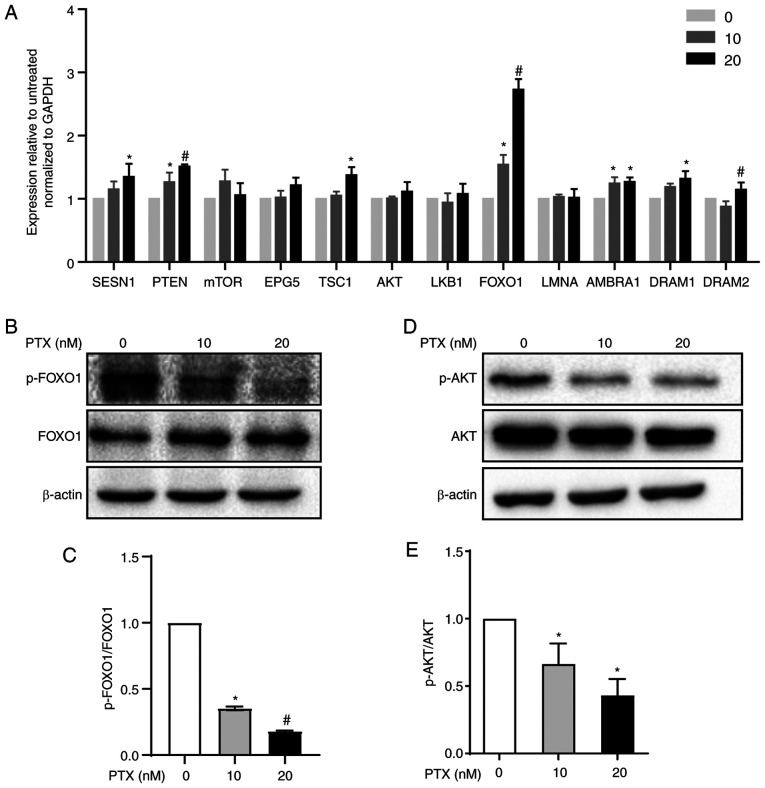
Figure 4.
Autophagy regulatory pathway induction by PTX in MDA-MB-231 cells. (A) mRNA expression levels of autophagy signaling pathway-related genes in response to treatment with 10 and 20 nM PTX. GAPDH was used as an internal control. (*P<0.05 vs. 0 nM PTX; #P<0.05 vs. 10 nM PTX). (B) Protein expression of FOXO1 and p-FOXO1 and (C) semi-quantification of the p-FOXO1/FOXO1 ratio (*P<0.05 vs. 0 nM PTX; #P<0.05 vs. 10 nM PTX). (D) Protein expression of AKT and p-AKT and (E) semi-quantification of the p-AKT/AKT ratio (*P<0.05 vs. 0 nM PTX). β-actin was used as an internal control. Data are presented as the means ± SD of three independent experiments. PTX, paclitaxel; FOXO1, forkhead box transcription factor O1; p-, phosphorylated; SESN1, sestrin 1; PTEN, phosphatase and tensin homolog; mTOR, mechanistic target of rapamycin kinase; EPG5, ectopic P-granules autophagy protein 5 homolog; TSC1, TSC complex subunit 1; AKT, serine/threonine kinase 1; LKB1, serine/threonine kinase 11; LMNA, lamin A/C; AMBRA1, autophagy and beclin 1 regulator 1; DRAM1, DNA damage regulated autophagy modulator 1; DRAM2, DNA damage regulated autophagy modulator 2.

