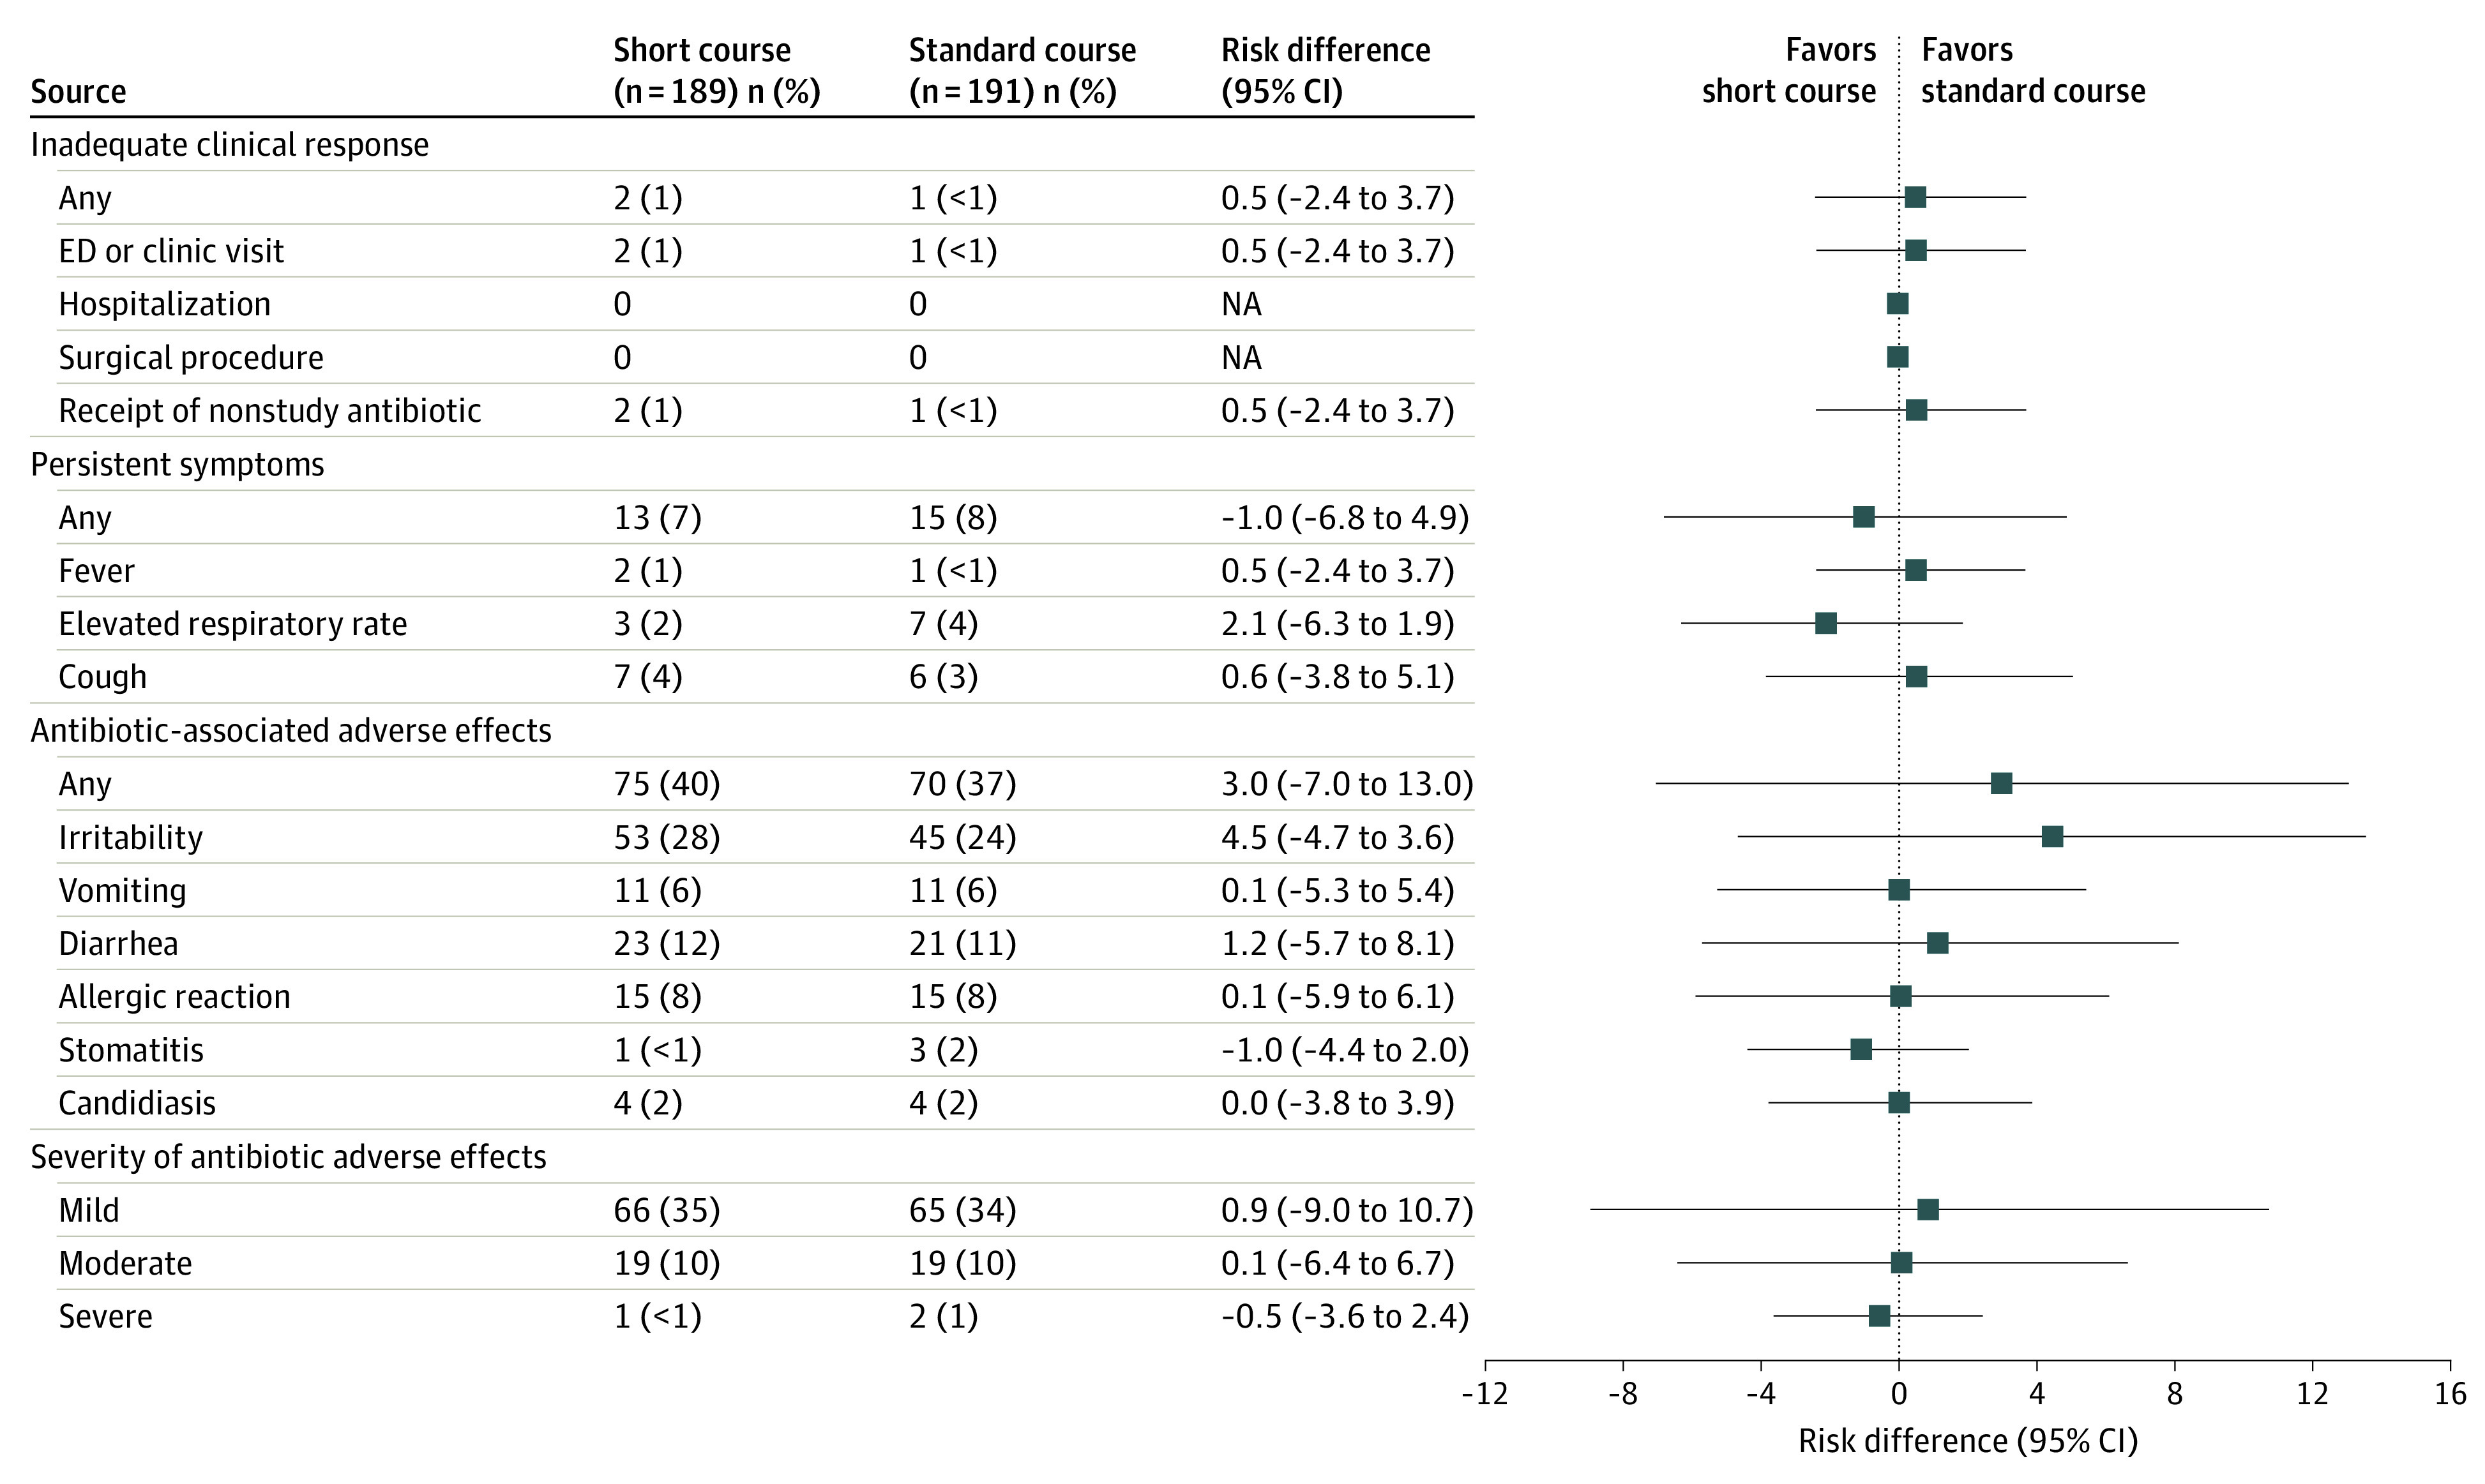
Figure 3. Inadequate Clinical Response, Persistent Symptoms, and Antibiotic-Associated Adverse Effects, Intention-to-Treat Population at Outcome Assessment Visit 1.

Frequencies (%) by treatment strategy and risk differences (95% CIs) for each component of the desirability of outcome ranking. Risk differences were compared using Fisher exact tests. The Newcombe method with continuity correction was used to compute 95% CIs for risk differences.
