Figure 2.

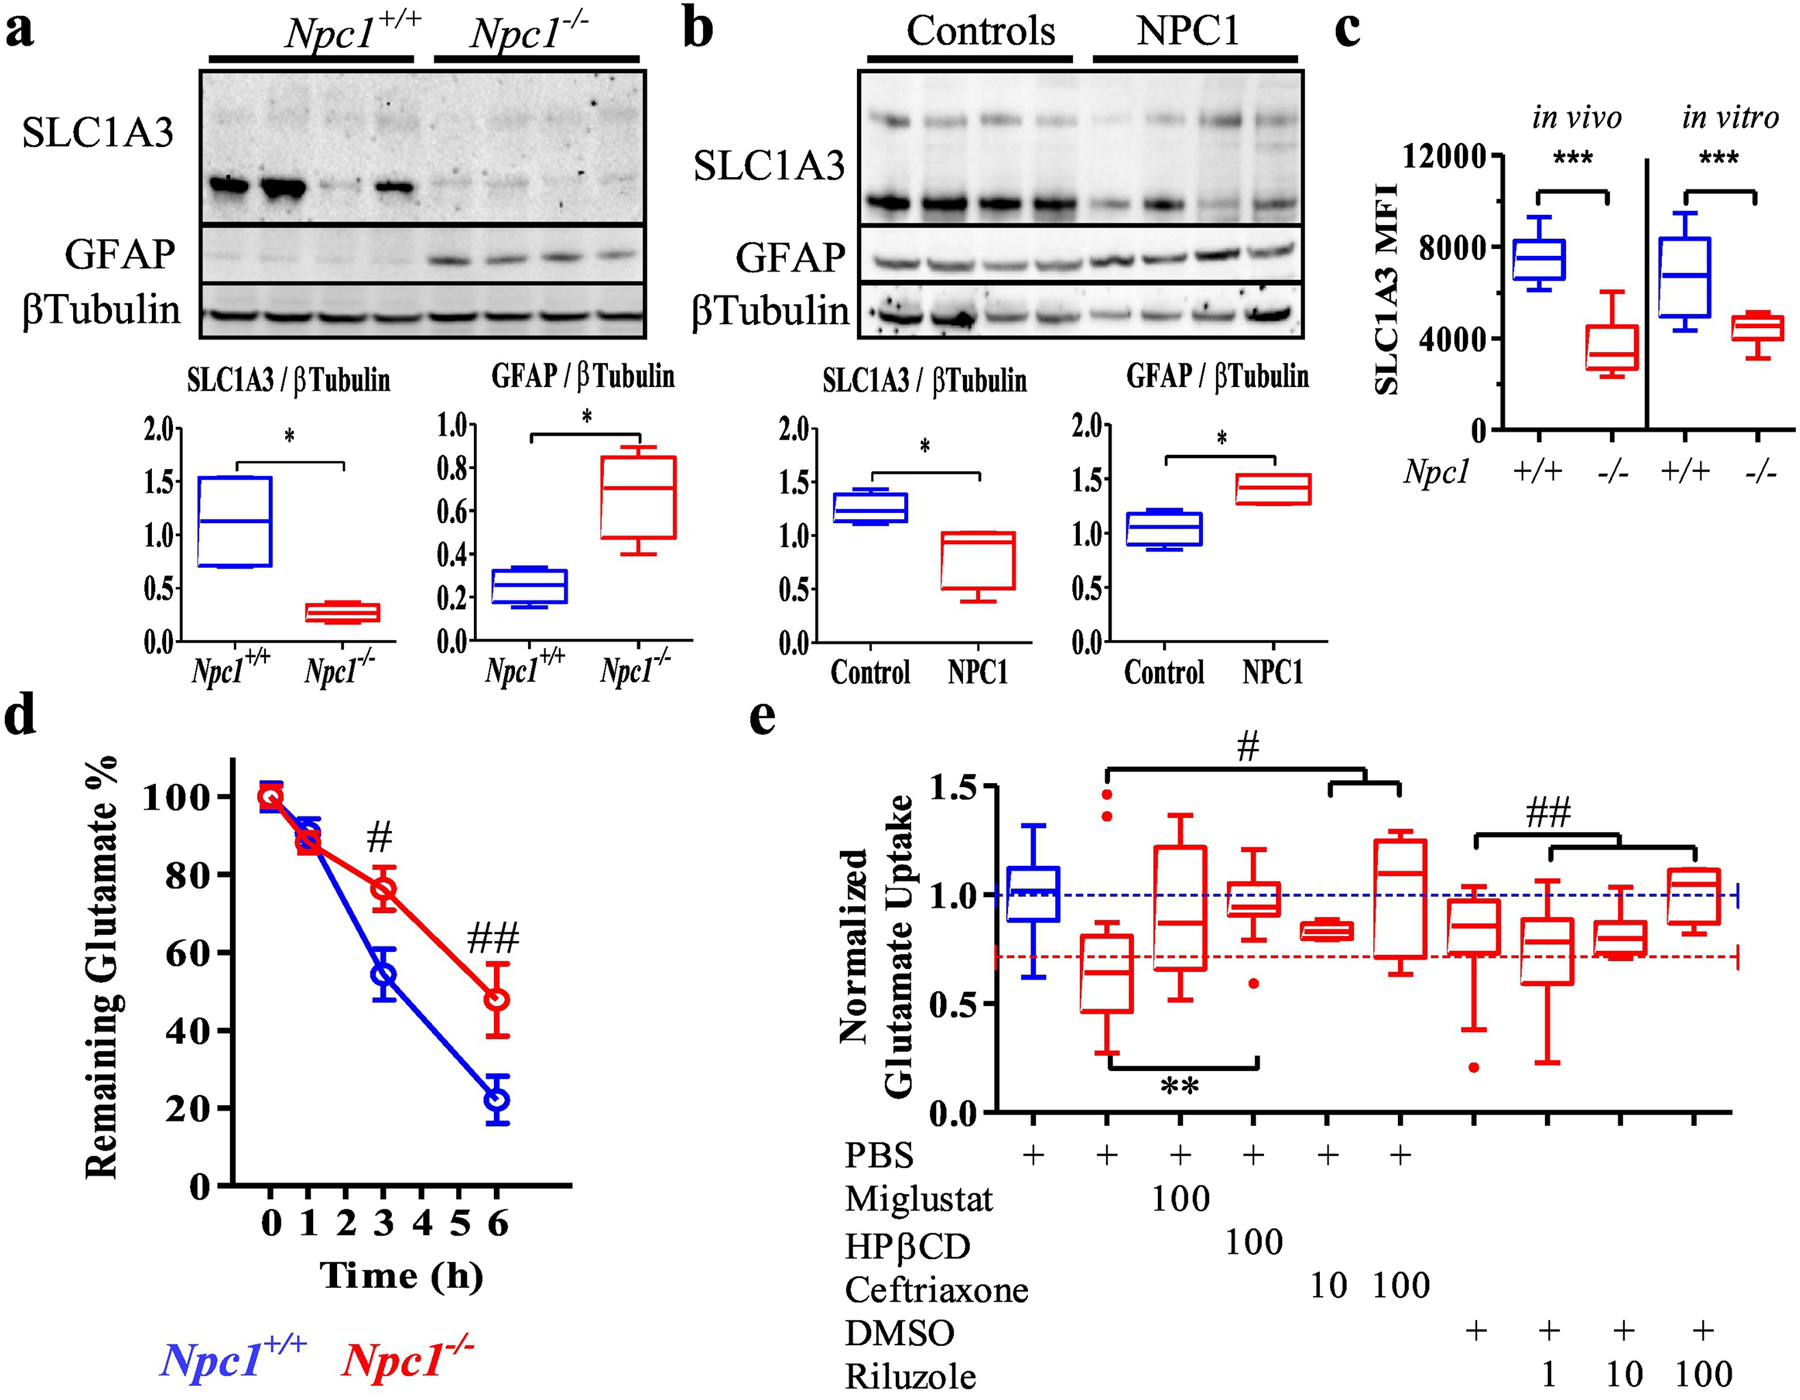
SLC1A3 dysregulation in Niemann-Pick type C. a Western blot analysis of SLC1A3, GFAP and βTubulin expression in 7-week-old mouse cerebellar extracts and densitometric quantification. N=4. b Western blot analysis of SLC1A3, GFAP and βTubulin expression in NPC1 and control human cerebellar extracts and densitometric quantification. N=4 c SLC1A3 surface expression level (Mean Fluorescence Intensity) on astrocytes isolated from 7-week-old cerebellar tissue (in vivo) or primary cerebellar astrocytes cultured (in vitro) from Npc1+/+ and Npc1−/− mice. d Decrease in glutamate levels in the culture media from Npc1+/+ and Npc1−/− primary astrocytes. e Tukey box and whisker plot of glutamate uptake from culture media was significantly (p<0.01) reduced in Npc1−/− astrocytes compared to uptake by Npc1+/+ astrocytes. Data was normalized to Npc1+/+ uptake. The average values for Npc1+/+ (blue) and Npc1−/− (red) are indicated by dashed lines. Glutamate uptake by Npc1−/− astrocytes was increased by treatment with miglustat (p=0.07), HPβCD (p<0.005), ceftriaxone (p<0.05) or riluzole (p<0.005). PBS was the vehicle for miglustat, HPβCD and ceftriaxone. DMSO was the vehicle for riluzole. Drug concentrations are in micromolar. Npc1+/+ (blue), Npc1−/− (red). *p<0.05, **p<0.01 and ***p<0.001 Mann-Whitney, #p<0.05 and ##p<0.01 ANOVA.
