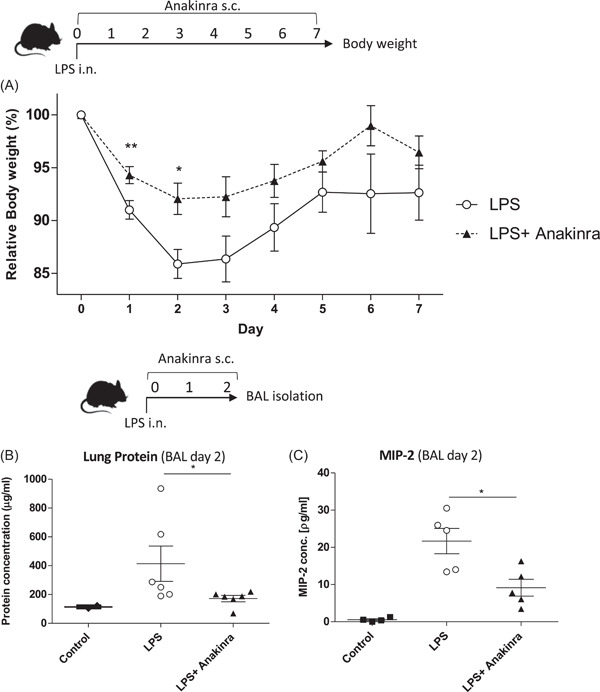
Figure 1.

(A) Shown are relative changes in body weight over 7 days in LPS challenged groups (LPS), and LPS challenged + Anakinra‐treated groups (Anakinra) from three independent experiments, n = 9. (B) Protein concentration (mean ± SEM) in BAL fluids 2 days after LPS challenge assessed by BCA assay from LPS challenged groups (LPS), LPS challenged + Anakinra‐treated groups (LPS + Anakinra) compared to naïve mice (Control). Two independent experiments, n = 6. (C) MIP‐2 concentration (mean ± SEM) in BAL fluids 2 days after LPS challenge assessed by ELISA, two independent experiments n = 5. BAL, bronchoalveolar lavage; ELISA, enzyme‐linked immunoassay; LPS, lipopolysaccharide
