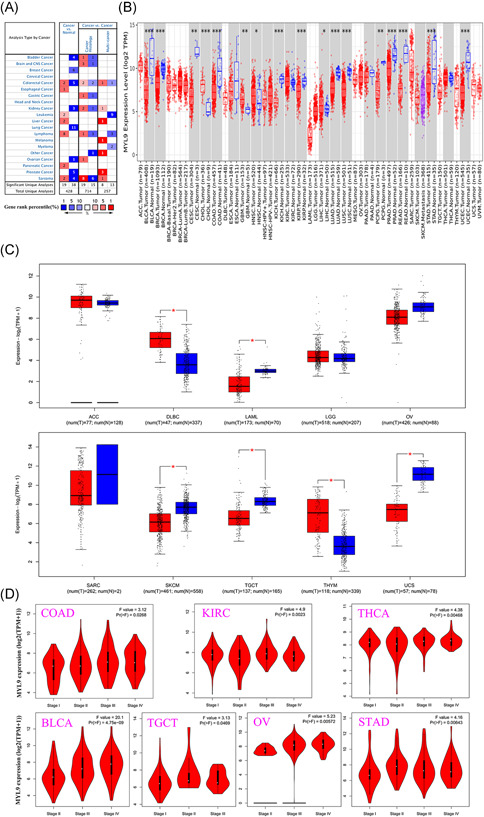
Figure 1.

The expression level of myosin light chain 9 (MYL9) in different tumors. (A) The expression level of MYL9 in different types of cancer and normal tissues by using the Oncomine database (the threshold of the p value is .0001, fold change is 2, and gene ranking is top 10%). (B) The expression of the MYL9 gene was analyzed by TMIER 2.0 in different cancers. (C) The box plot of MYL9 gene expression was supplied for different tumors by using the TCGA and GTEx database. (D) The expression levels of the MYL9 gene were analyzed by the main pathological stages of colon adenocarcinoma (COAD), kidney renal clear cell carcinoma (KIRC), thyroid carcinoma (THCA), bladder urothelial carcinoma (BLCA), testicular germ cell tumors (TGCT), ovarian serous cystadenocarcinoma (OV), and stomach adenocarcinoma (STAD). Log2 (TPM + 1) was applied for log‐scale. * p < .05; ** p < .01; *** p < .001, **** p < .0001
