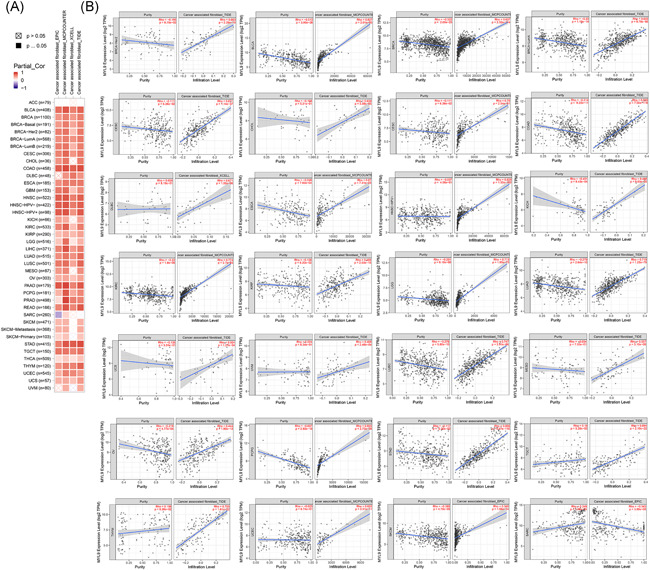
Figure 3.

The expression level of myosin light chain 9 (MYL9) correlated with the immune infiltrating level of cancer‐associated fibroblasts. Through the EPIC, MCPCOUNTER, XCELL, and TIDE algorithms, the heatmap about the potential relationship between the infiltration level of different immune cells and MYL9 gene expression was exhibited by using the TIMER2.0 tool in different tumors. The heatmap (A), and the scatter plot (B) with the highest Spearman's p value results in four datasets were given
