Figure 6.

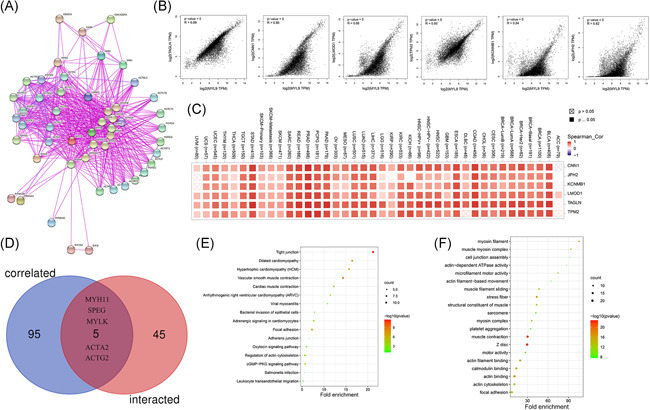
The enrichment analysis of the myosin light chain 9 (MYL9)‐related gene. (A) The available experimentally determined MYL9‐binding proteins were obtained by using the STRING tool. (B) The correlation analysis between the top 6 gene (TAGLN, CNN1, LMOD1, TPM2, KCNMB1, and JPH2) of those correlated with MYL9 expression and MYL9 via using GEPIA2. (C) The correlation analysis between the top 6 gene (TAGLN, CNN1, LMOD1, TPM2, KCNMB1, and JPH2) of those correlated with MYL9 expression and MYL9 via using TIMER 2.0. (D) Venn diagram showed an intersection analysis of the MYL9 binding and correlated genes. KEGG pathway analysis (E) and GO analysis (F) were performed based on the MYL9 binding and interacted genes
