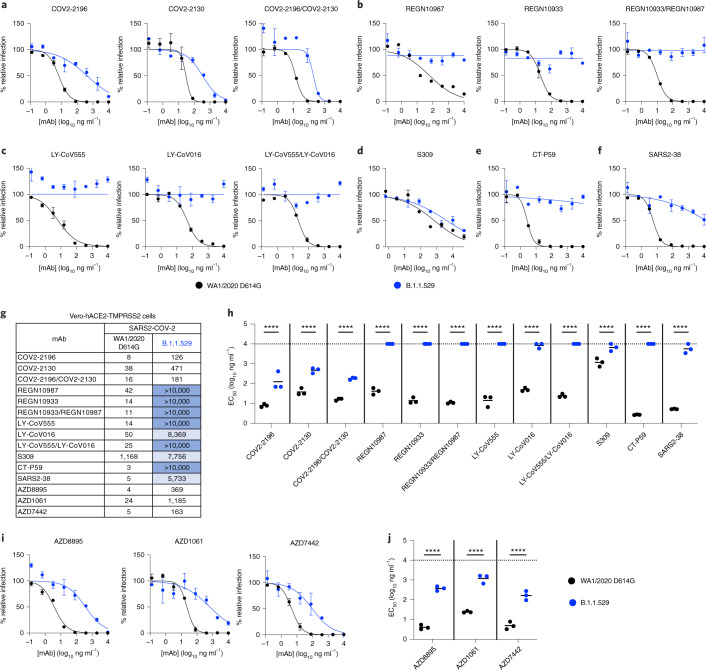
Fig. 3. Neutralization of SARS-CoV-2 B.1.1.529 Omicron strain by mAbs in Vero-hACE2-TMPRSS2 cells.
a–f, Neutralization curves in Vero-hACE2-TMPRSS2 cells comparing the sensitivity of SARS-CoV-2 strains with the indicated mAbs (S309, COV2-2196, COV2-2130, REGN10933, REGN10987, LY-CoV555, LY-CoV016, CT-P59 and SARS2-38) with WA1/2020 D614G and B.1.1.529. Also shown are the neutralization curves for antibody cocktails (COV2-2196/COV2-2130, REGN10933/REGN10987 or LY-CoV555/LY-CoV016). For data with mAb combinations, the x axis represents the total concentration of mAb used. One representative experiment of three performed in technical duplicate is shown. Error bars indicate range of technical replicates. Data (% relative infection) are normalized to a no-mAb control. g, Summary of EC50 values (ng ml−1) of neutralization of SARS-CoV-2 viruses (WA1/2020 D614G and B.1.1.529) performed in Vero-hACE2-TMPRSS2 cells. Data are the geometric mean of three experiments. Blue shading: light, EC50 > 5,000 ng ml−1; dark, EC50 > 10,000 ng ml−1. h, Comparison of EC50 values by mAbs against WA1/2020 D614G and B.1.1.529. i, j, Neutralization curves in Vero-hACE2-TMPRSS2 cells comparing WA1/2020 D614G and B.1.1.529 infection in the presence of AZD1061, AZD8895 and the combination AZD7442. h, j, Three experiments; ****P < 0.0001; two-way ANOVA with Sidak’s post test. Each symbol represents neutralization data from an individual experiment. Bars indicate mean values. The dotted line indicates the upper limit of dosing of the assay.

