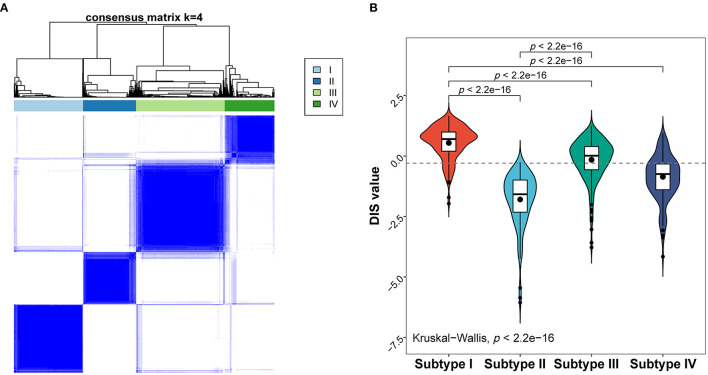
Figure 5.
Molecular subtypes of the febrile condition cases obtained based on their gene expression profiles. (A) Heat map of the consensus matrix with four clusters obtained using unsupervised clustering. (B) Distribution of the diagnostic score in different molecular subtypes; p-values are only shown for comparisons with statistically significant differences.

