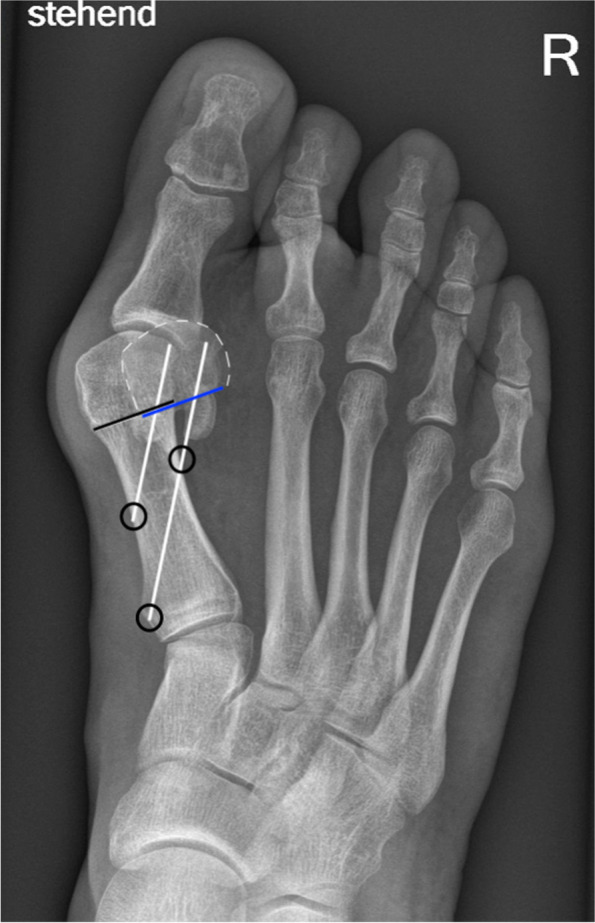
Fig. 1.

Preoperative planning of the Chevron osteotomy: The black line indicates the level and length of the osteotomy. The blue line has the same length as the black. The overlap of both lines (black&blue) simulates the amount of the lateral shift in relation to the width of the metatarsal shaft at the level of the osteotomy (in this case ~ 60–70%). The white lines simulate the orientation and length of both screws. The black circles demonstrate the cortical fixation points of the screws. The proximal screw exists through the lateral cortex, the distal screw through the osteotomy
