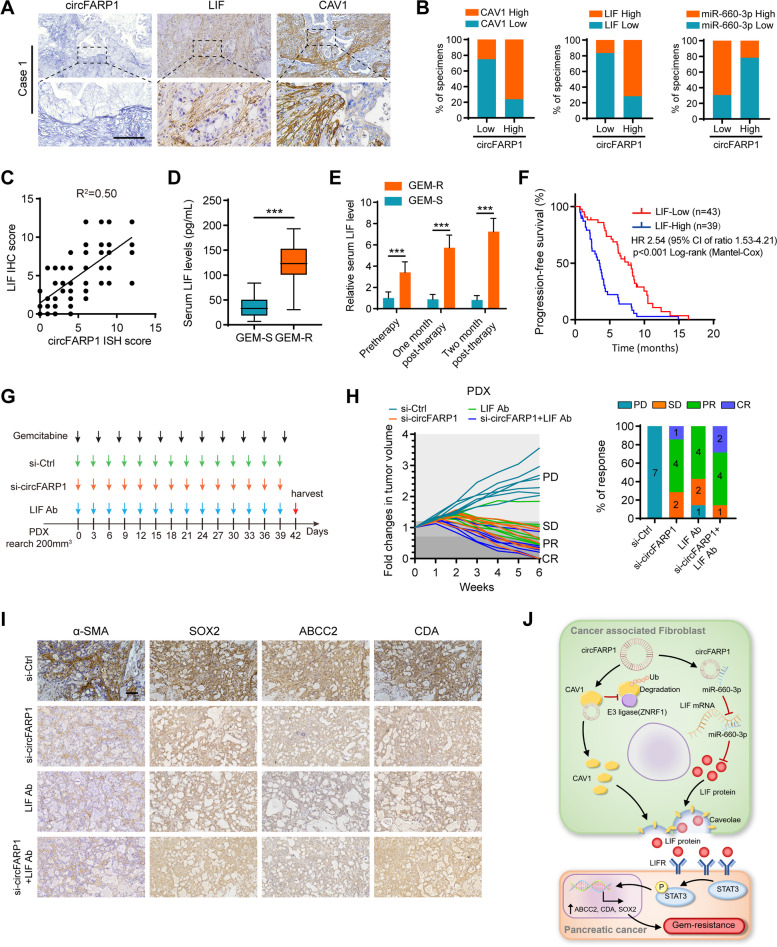
Fig. 8.
Clinical implication of the circFARP1/LIF axis in PDAC. A Representative images of ISH for circFARP1 and IHC for CAV1 and LIF in PDAC tissues. Scale bars, 100 μm. B Quantification of the percentage of specimens with low or high CAV1, miR-660-3p, and LIF in the low or high circFARP1 expression groups. C Correlation analysis of circFARP1 and LIF expression in PDAC tissues (n = 82). D-E ELISA analysis of the serum LIF level in GEM-S (n = 38) and GEM-R patients (n = 44). F Kaplan–Meier survival curves for PDAC patients who received GEM chemotherapy with high or low circFARP1 expression. G Timeline schematic for the treatment of mice with PDX. Colored arrows indicate the times at different treatment time points. H Fold changes in tumor volume and response rates in PDXs that received the indicated treatments (n = 7). The chemotherapy responses were evaluated using the RECIST standard. I Representative images of IHC for α-SMA, SOX2, ABCC2, and CDA in the PDX. Scale bars, 50 μm. J Schematic illustration of the mechanism by which circFARP1 enables CAFs to promote GEM chemoresistance in pancreatic cancer. Data are expressed as the mean ± SD. ***p<0.001

