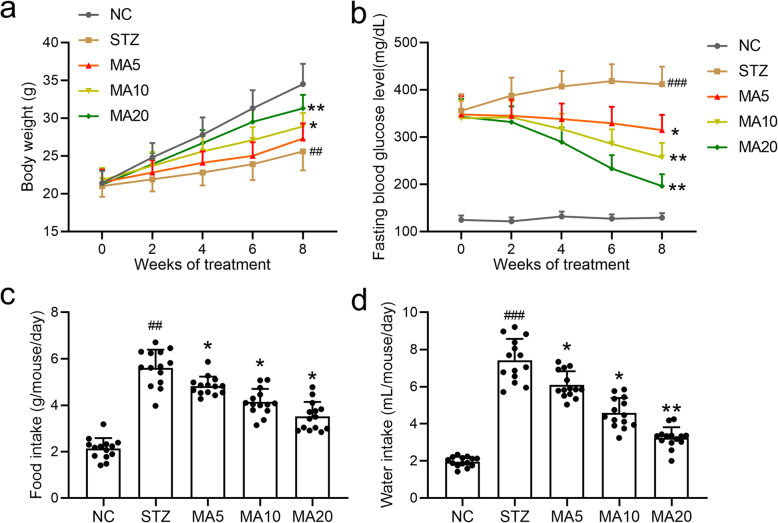
Fig. 1.
Effects of maslinic acid treatment on body weight (a), fasting blood glucose levels (b), average food intake (c) and average water intake (d) in mice model of diabetic nephropathy. All mice had free access to food and water at all times. The volume of consumed water and amount of food were recorded. Fasting blood glucose levels and body weight were measured once every 2 weeks for 8 weeks. N = 14 for each group. Data are presented as mean ± SD. ##p < 0.01, ###p < 0.001 compared to NC group, *p < 0.05, **p < 0.01compared to STZ group

