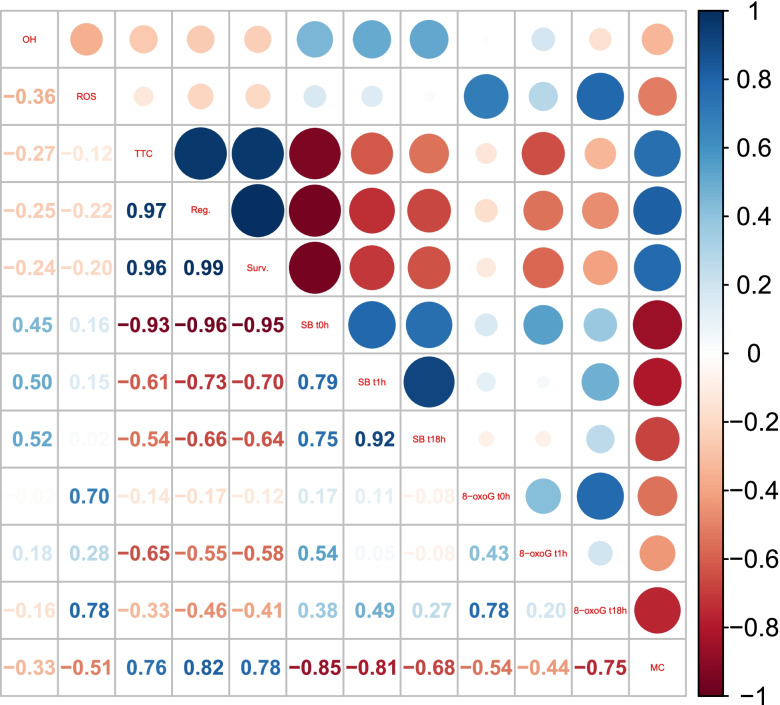
Fig. 9.
The Spearman correlation coefficient between the means of oxidative stress measurements (٠OH, ROS), viability measurements (TTC, regrowth, survival), DNA strand breaks measured directly after desiccation (SB t0h), after 1 h of rehydration (SB t1h) or after 18 h of rehydration (SB t18h), and the amount of detected 8-oxo G measured directly after drying (8-oxoG t0h), after 1 h of rehydration (8-oxoG t1h) or after 18 h of rehydration (8-oxoG t18h). The size of the circles represents the level of correlation (r), bigger circles indicate that a given trait correlates at higher level. Blue color indicates positive correlations and red indicates negative correlations

