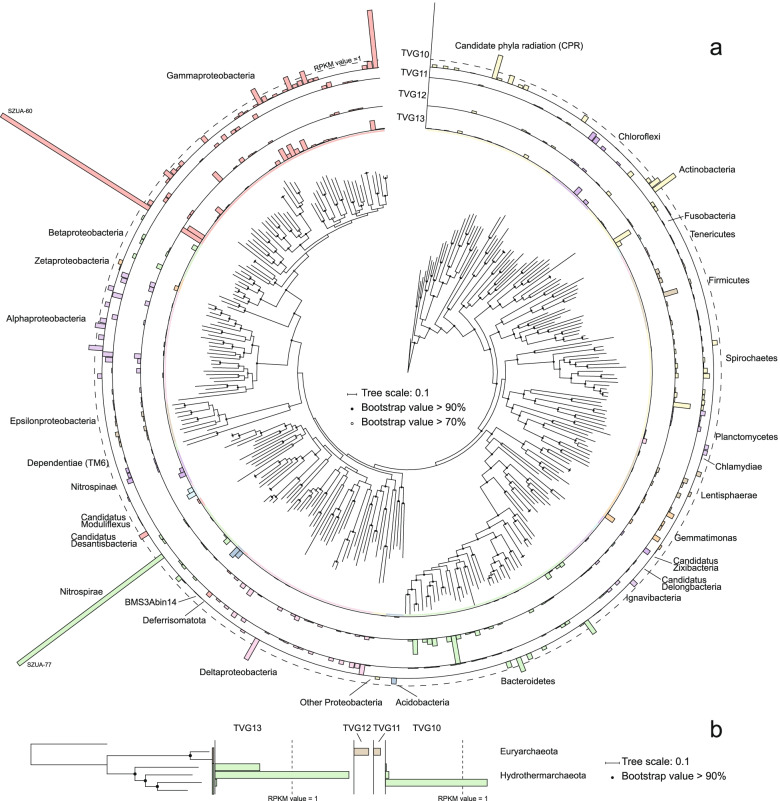
Fig. 1.
Phylogenetic tree and relative abundances of bacterial (a) and archaeal (b) MAGs in the current study. The maximum likelihood phylogenetic tree was constructed based on 120 bacterial and 122 archaeal marker genes. The scale bar represents 0.1 amino acid substitutions per sequence position. The bar plots are based on the relative abundance of each MAG in each sample, and the color of the bars represents the taxonomy of the MAG. The two most abundant MAGs (SZUA-60 and SZUA-77) are labeled. The full phylogenetic tree is available in Supplementary Data 1 (bacterial) and 2 (archaeal), and the details of MAG abundance are available in Table S2

