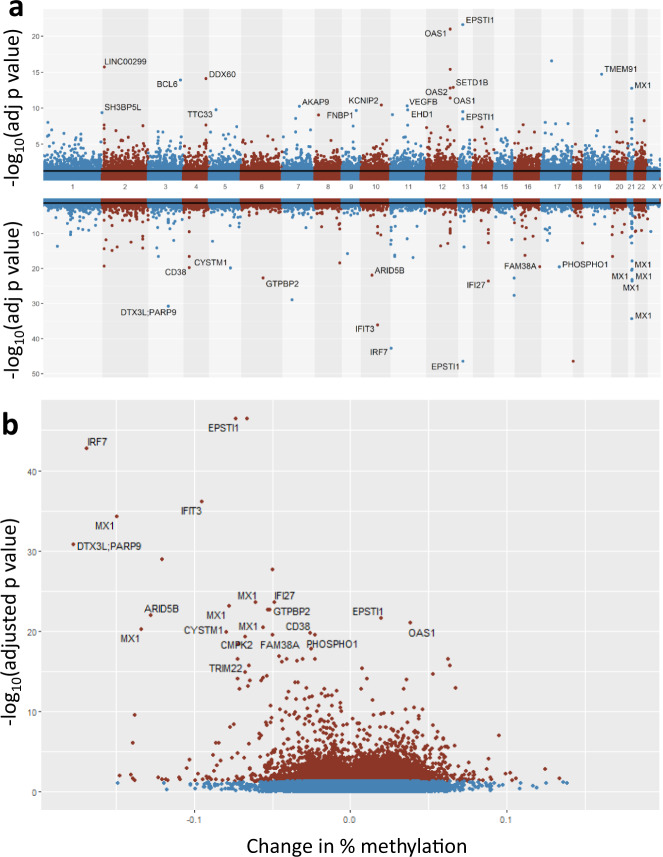
Fig. 2. Differentially methylated CpGs associated with SARS-CoV-2 infection.
a Miami plot (top panel) of hypermethylated (top) and hypomethylated (bottom) probes in SARS-CoV-2+ compared to control samples. Significance lines represent FDR-adjusted P value <0.05 threshold. b Volcano plot of significant (red; FDR-adjusted P value <0.05) CpG sites (blue CpG sites have FDR-adjusted P value >0.05). Change in percentage methylation on the x axis represents the difference in average beta value at a site between cases and controls. Probes for intergenic CpG sites do not have gene annotations. Data used to plot this figure are available as Supplementary Data 5.

