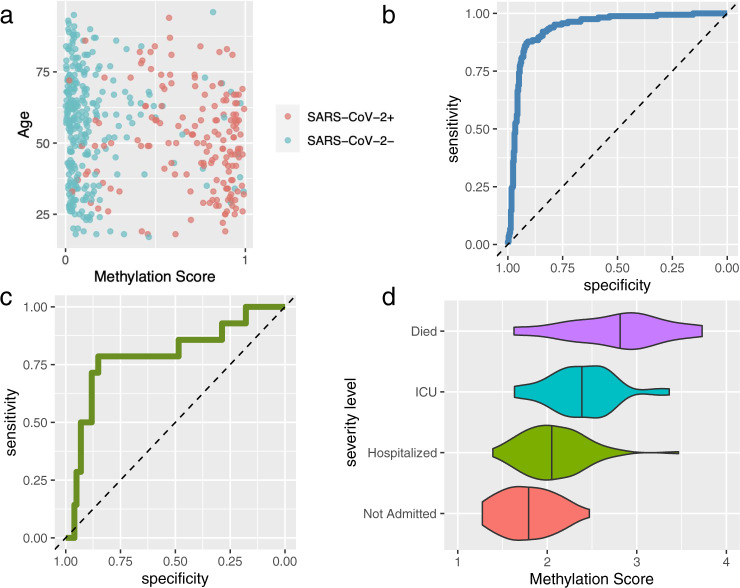
Fig. 4. Performance of SARS-CoV-2 infection status and severity predictive models.
a Out-of-sample case–control methylation score for all 460 individuals (164 SARS-CoV-2+, 296 SARS-CoV-2−) compared to case–control status, plotted by biological age. b Receiver-operating characteristic (ROC) curve for data in a. c ROC curve of cross-validated prediction of long hospital duration. d Violin and jittered scatter plots of severity methylation scores for each outcome in cases. Data used to plot this figure are available as Supplementary Data 6.

