
Figure 5.
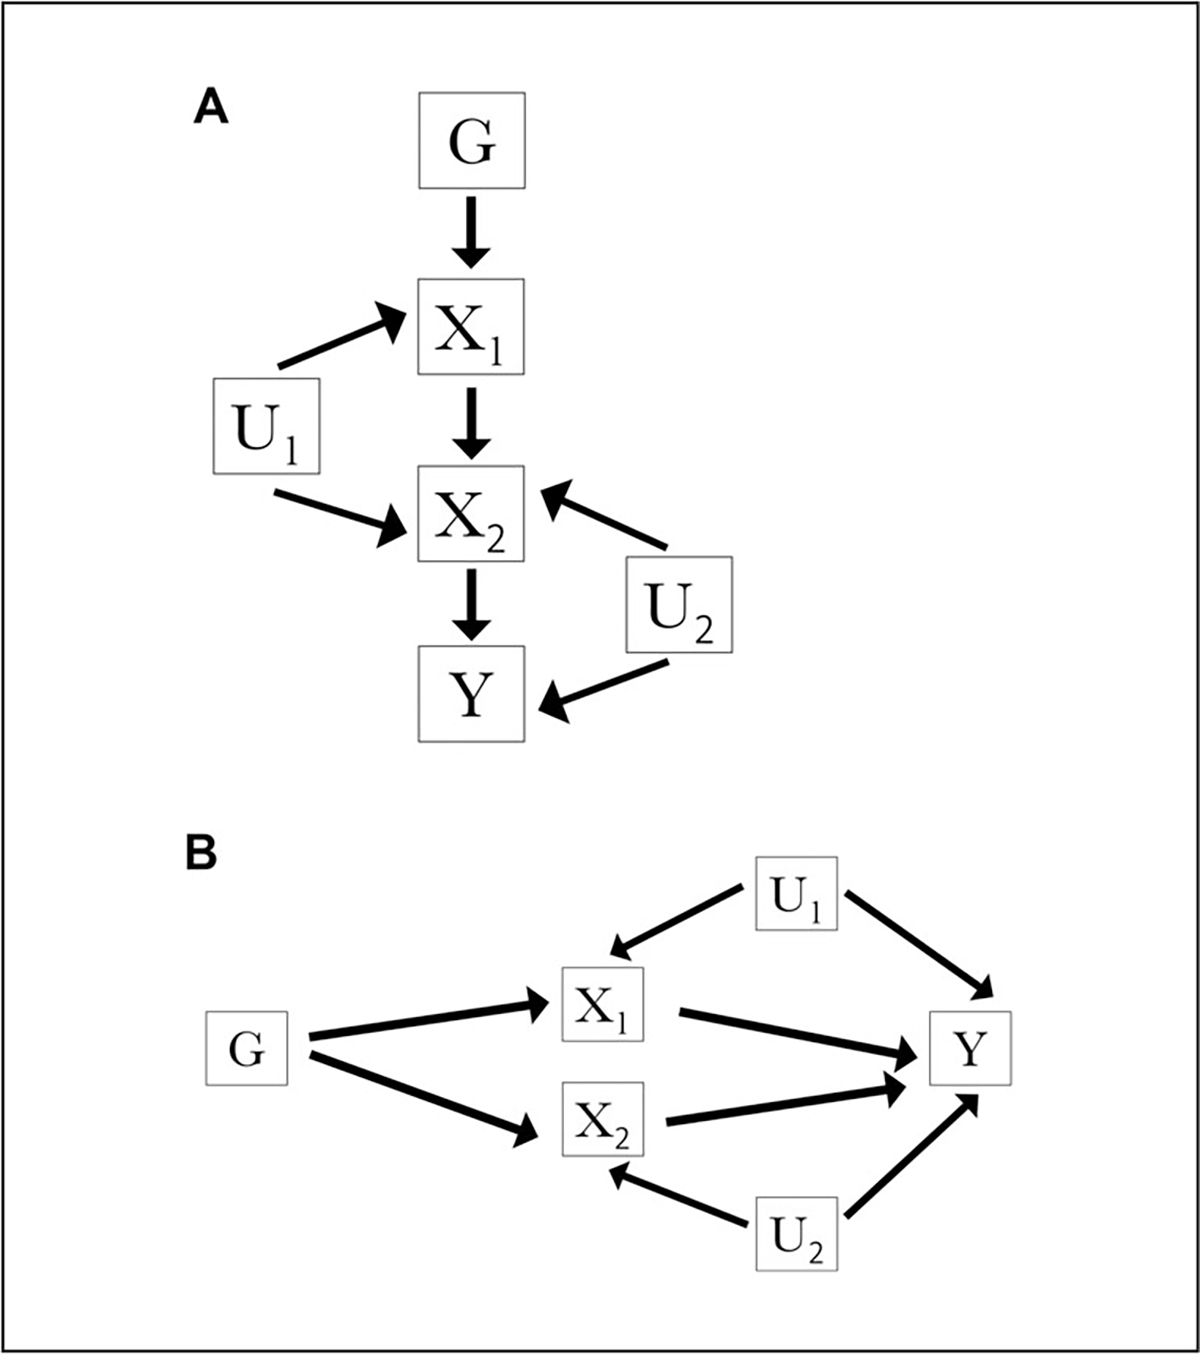
Illustration of vertical (A) and horizontal (B) pleiotropy as diagrammed by directed acyclic graphs. Depiction shown for genetic variant G, exposures X1 and X2, outcome Y, confounder of the X1-outcome association U1, and confounder of the X2-outcome association U2. In the vertical pleiotropy case illustrated in A, genetic variant G is associated with exposure X1, which exerts a downstream causal effect on exposure X2, which then exerts a causal effect on outcome Y. In the horizontal pleiotropy case illustrated in B, genetic variant G is associated with exposure X1 and independently associated with unrelated exposure X2, both exposures of which are associated with outcome Y.