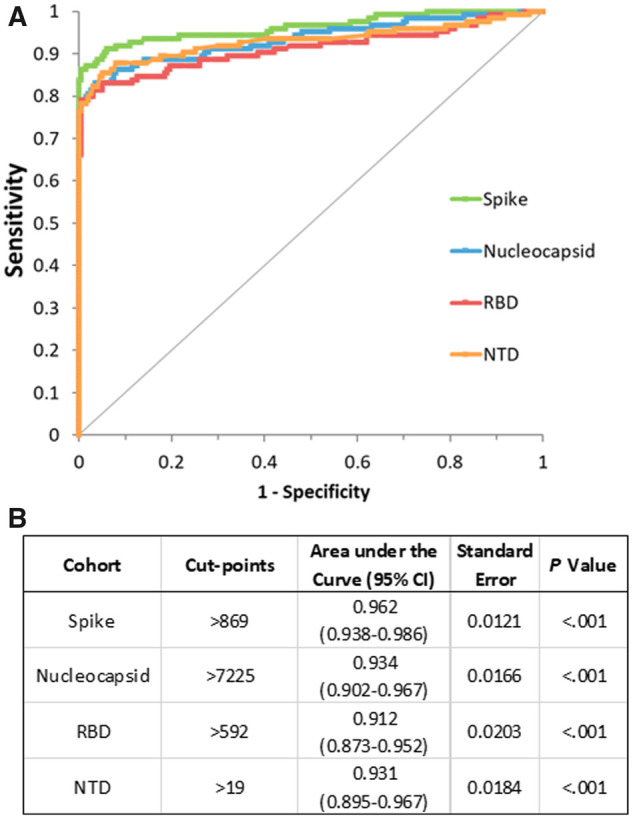
Fig. 1.

ROC analysis for the IgG antibodies to 4 SARS-CoV-2 antigens detected by MSD assay. (A) ROC plots for the IgG antibodies to SARS-CoV-2 antigens. (B) Cut points that resulted in a specificity of at least 99.0% was chosen. AUC values for each individual antibodies, corresponding standard errors and P values are listed. P denotes statistical significance of difference from AUC = 0.5 or line of no discrimination based on z test, calculated using the Excel AnalyzeIT software.
