. 2022 Jan 19;130(1):017001. doi: 10.1289/EHP8083

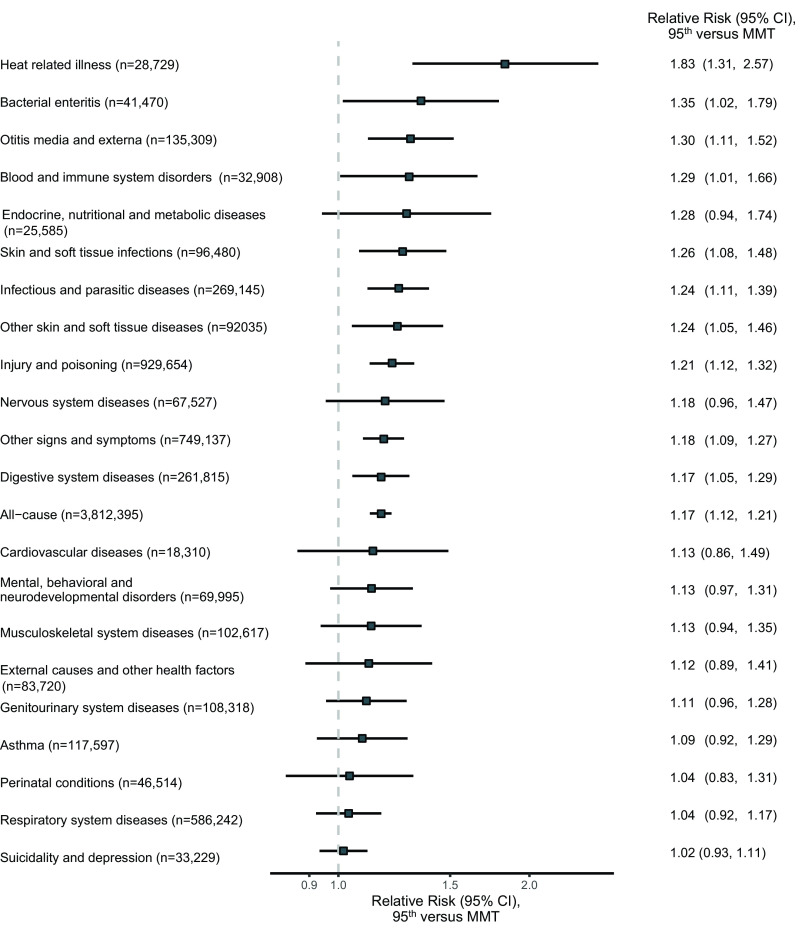
Figure 2.

Figure 2 is a forest plot, plotting (bottom to top), ranging as 33,229 cases of suicidality and depression, 586,242 cases of respiratory system diseases, 46,514 perinatal conditions, 117,597 cases of asthma, 108,318 cases of genitourinary system diseases, 83,720 cases of external causes and other health factors, 102,617 cases of musculoskeletal system diseases, 69,995 cases of mental, behavioral, and neurodevelopmental disorders, 18,310 cases of cardiovascular diseases, 3,812,395 cases of all cause, 261,815 cases of digestive system diseases, 749,137 cases of other signs and symptoms, 67,527 cases of nervous system diseases, 929,654 cases of injury and poisoning, 92,035 cases of other skin and soft tissue diseases, 269,145 cases of infectious and parasitic diseases, 96,480 skin and soft tissue infections, 25,585 cases of endocrine, nutritional, and metabolic diseases, 32,908 cases of blood and immune system disorders, 135,309 cases of otitis media and externa, 41,470 cases of bacterial enteritis, and 28,729 cases of heat related illness (y-axis) across Relative risk (95 percent confidence interval), ninety-fifth versus minimum morbidity temperature, ranging from 0.9 to 1.0 in increments of 0.1 and from 1.0 to 2.0 in increments of 0.5 (x-axis).

RRs and 95% CIs of the association of specific causes of emergency department visits with Tmax. RRs contrast the 95th percentile of the hospital-specific warm season (May to September) Tmax distribution to the hospital-specific minimum morbidity temperature (MMT) over lag 0–7 d among 47 participating children’s hospitals from May to September from 2016 to 2018. The temperature–ED visit association was modeled with a quasi-Poisson regression with distributed-lag nonlinear model for each hospital, controlling for temporal trends, seasonality, relative humidity, federal holidays, and day of the week. RRs are then pooled across the 47 participating hospitals using multivariate random-effect meta-analyses with hospital-specific mean and range of temperatures as the predictors. Note: CI, confidence interval; RR, relative risk; Tmax, mean daily maximum temperature.