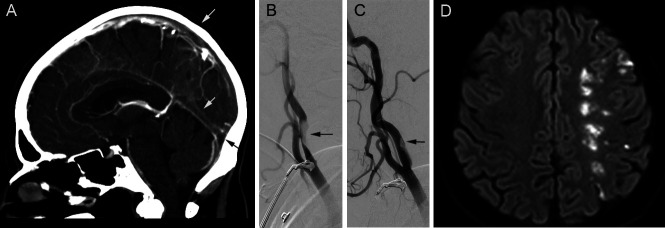
Figure 1.
CT, angiogram and MRI images of thromboses and stroke. (A) Initial CT venogram demonstrating thromboses in superior sagittal and straight sinuses and torcula (arrows). (B, C) Angiograms during mechanical thrombectomy show near occlusive thrombus in the left internal carotid artery (B) and partially occlusive thrombus in the right internal carotid artery (C). (D) MRI (diffusion weighted image) shows an internal watershed infarct in the left hemisphere.

