
Fig. 2 |. Cerebrovascular simplification in ppil4-depleted zebrafish is prevented by overexpression of human PPIL4WT but not by IA-associated PPIL4G132S.
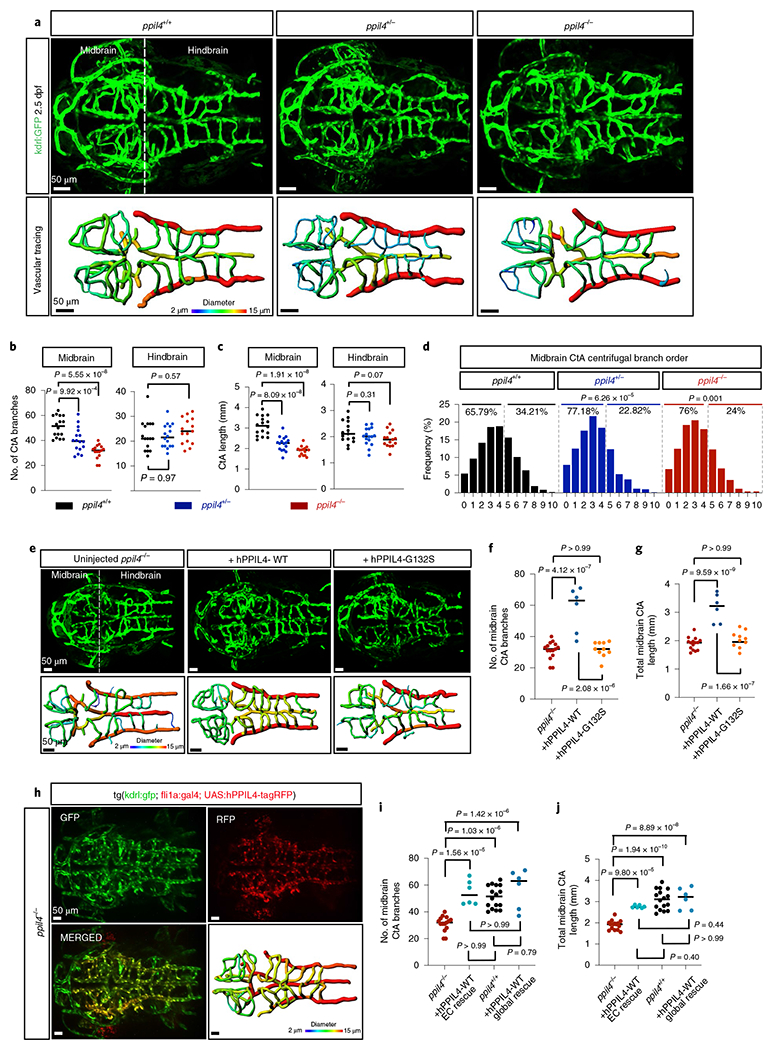
a, MIP of confocal z-stack images and vessel segmentation of ppil4+/+ (n = 16), ppil4+/− (n = 16) and ppil4−/− (n = 15) embryos in tg(kdrl:gfp)zn1 background at 2.5 dpf. b,c, Quantifications of CtA branches (b) and total length (c) in ppil4+/+ (n = 16), ppil4−/− (n = 16) and ppil4−/− (n = 15) embryos. d, Branching level of midbrain CtAs in centrifugal order n = 874, 609 and 521 vessels in ppil4+/+ (n = 16), ppil4+/− (n = 16) and ppil4−/− (n = 14), respectively. e–g, Global rescue experiments. n = 15, 6 and 10 for uninjected, hPPIL4WT- and hPPIL4G132-injected ppil4−/−, respectively. e, MIP of confocal z-stack images and vessel segmentation at 2.5 dpf. f,g, Comparison of midbrain CtA branches (f) and total length (g). h–j, Endothelial-specific rescue experiments. n = 15, 6, 16 and 6 for uninjected ppil4−/−, endothelial-specific rescue of ppil4−/− with hPPIL4-WT, ppil4−/− and global rescue of ppil4−/− with hPPIL4-WT. h, MIP of a representative confocal image of UAS:hPPIL4-WT-tagRFP-injected embryo in ppil4−/−;tg(kdrl:gfp)zn1;tg(fli1a:gal4) background at 2.5 dpf, n = 6. i,j, Comparison of midbrain CtA branches (i) and total length (j). Individual values shown with scatter dot plot and median for all quantifications. Statistical tests: one-way ANOVA followed by Dunnett’s multiple comparison (b,c); pairwise Fisher’s exact test with FDR correction (d). f,g,i,j, One-way ANOVA followed by Bonferroni multiple comparison test. Scale bar, 50 μm. EC, endothelial cell.