
Fig. 5 |. PPIL4 potentiates Wnt activity by binding to JMJD6.
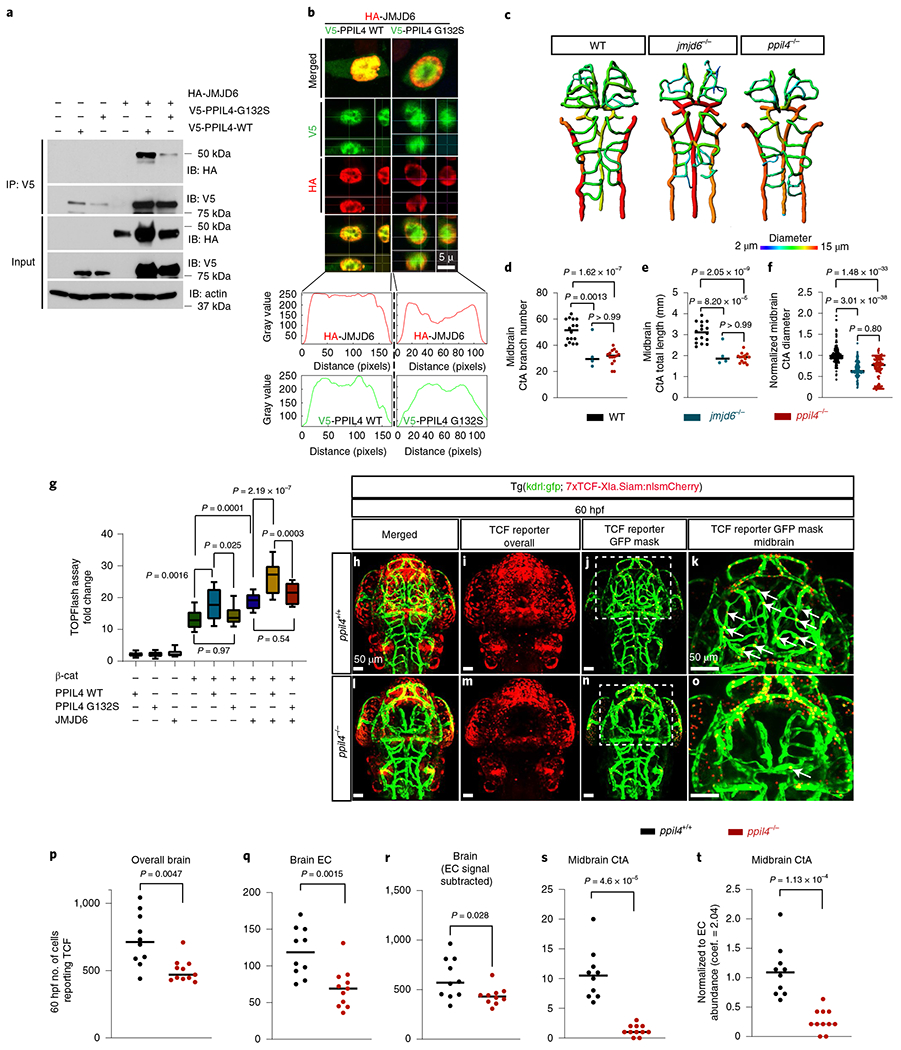
a, Co-immunoprecipitation of JMJD6 with PPIL4WT or PPIL4G132S in HEK293 cells. Input: whole cell lysates, n = 3 biological replicates. b, Orthogonal section from representative confocal images of HEK293 cells expressing HA-JMJD6, V5-PPIL4WT and V5-PPIL4G132S. Lower panels: co-localization of red and green channels within the nucleus, n = 3 biological replicates. c-f, Brain vessel segmentation and phenotypic assessment in wild-type (n = 16), ppil4−/− (n = 15) and jmjd6−/− (n = 4) at 2.5 dpf. g, Effect of transient overexpression of JMJD6, PPIL4WT, PPIL4G132S or β-catenin on Wnt signaling activation (TOPFlash assay), n = 4 biological replicates. h-o, MIP of confocal z-stack images of ppil4+/+ (n = 10) and ppil4−/− (n = 11) embryos in tg(kdrl:gfp; 7xTCF-Xla.Siam:nlsmCherry) background at 60 hpf. j,n, Visualization of endothelial-specific Wnt activity using the Spots Mask application (Imaris). k,o, Higher magnification of the indicated areas in j and n, respectively. p-t, Quantification (Imaris) of TCF reporter signal in ppil4 +/+ (n = 10) and ppil4 −/− (n = 11) embryos at 60 hpf. See Methods for details of image processing and assembly. t, Number of TCF-reporting endothelial cells normalized to endothelial cell number using a coefficient of 2.04 obtained from endothelial cell abundance experiments (Methods). Individual values are shown with scatter dot plot and median in d-f and p-t. In g, the box extends from the 25th to the 75th percentile; the whiskers show the minimum and maximum values; and the line at the center is the median. Statistical tests: one-way ANOVA (d-g), followed by Dunnett’s (d-f) or Sidak’s (g) multiple comparison test. p-t, Two-tailed Student’s t-test. Scale bar, 5 μm in b and 50 μm in h-o. EC, endothelial cell.