
Extended Data Fig. 3 |. The impact of ppil4 depletion on cerebrovascular network is persistent at 5.5 dpf.
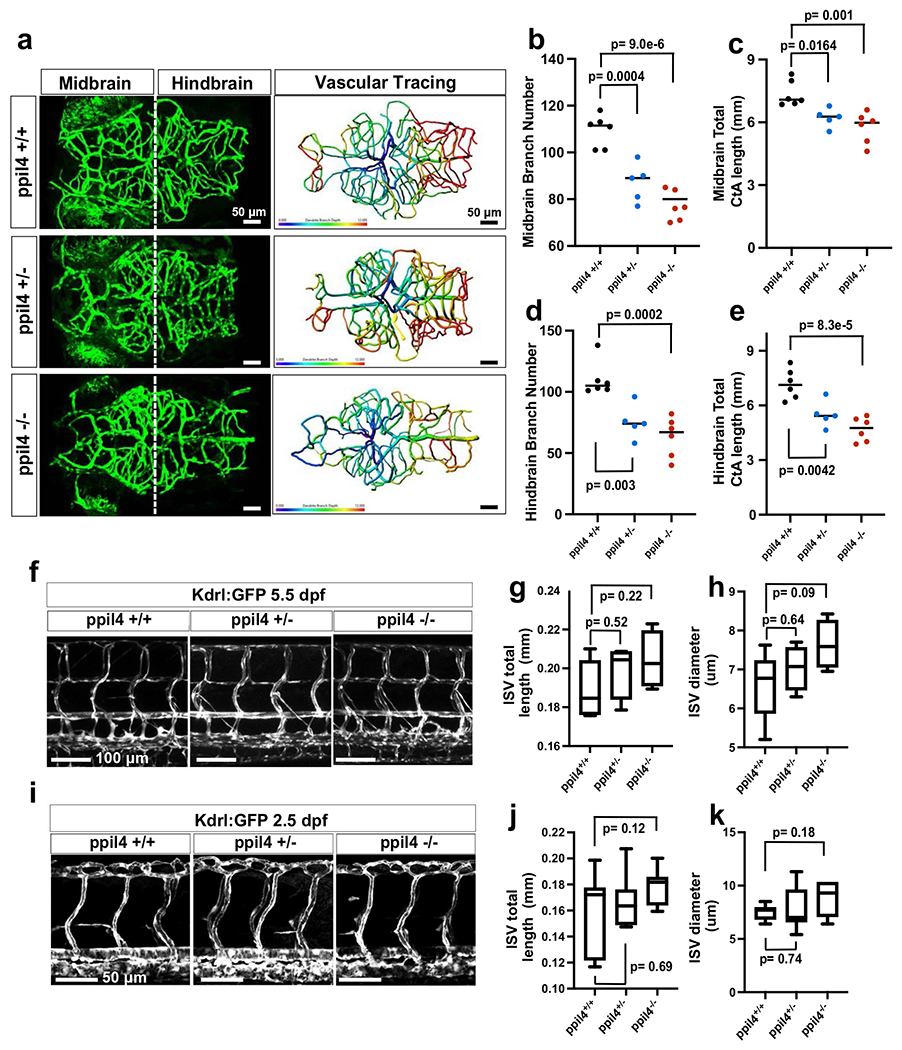
a, Left panels: Maximum intensity projection (MIP) of representative confocal z-stack images in 5.5 dpf old ppil4+/+ (n=6), ppil4+/− (n=5) and ppil4−/− (n=6) embryos in the tg(kdrl:gfp)zn1 background (dorsal-view and caudal facing left). Right panels: Brain vessel segmentation in the larvae shown at left (Imaris). Colors represent branch depth ranging from 0 to 12 (higher and lower branch depth shown in red and blue, respectively). b-e, Quantification of midbrain CtA branch number (b) and length (c); Quantification of hindbrain CtA branch number (d) and length (e) in ppil4+/+ (n=6), ppil4+/− (n=5) and ppil4−/− (n=6) embryos, f-h, Confocal images (f) and comparative assessment (g,h) of trunk vasculature in 5.5 dpf old ppil4+/+ (n=7), ppil4+/− (n=4) or ppil4−/− (n=4) zebrafish. i-k, Confocal images (i) and comparative assessment (j,k) of trunk vasculature in 2.5 dpf old, n=9 per genotype. Individual values shown with scatter dot plot and median in b-e. The box extends from the 25th to 75th percentile. The whiskers show the minimum and the maximum values, while the line in the middle of the box is median in g,h,j and k. Statistical tests: One-way ANOVA followed by Dunnett’s multiple correction for all comparisons. Scale bar: 50 μm in a and i, 100 μm in f.