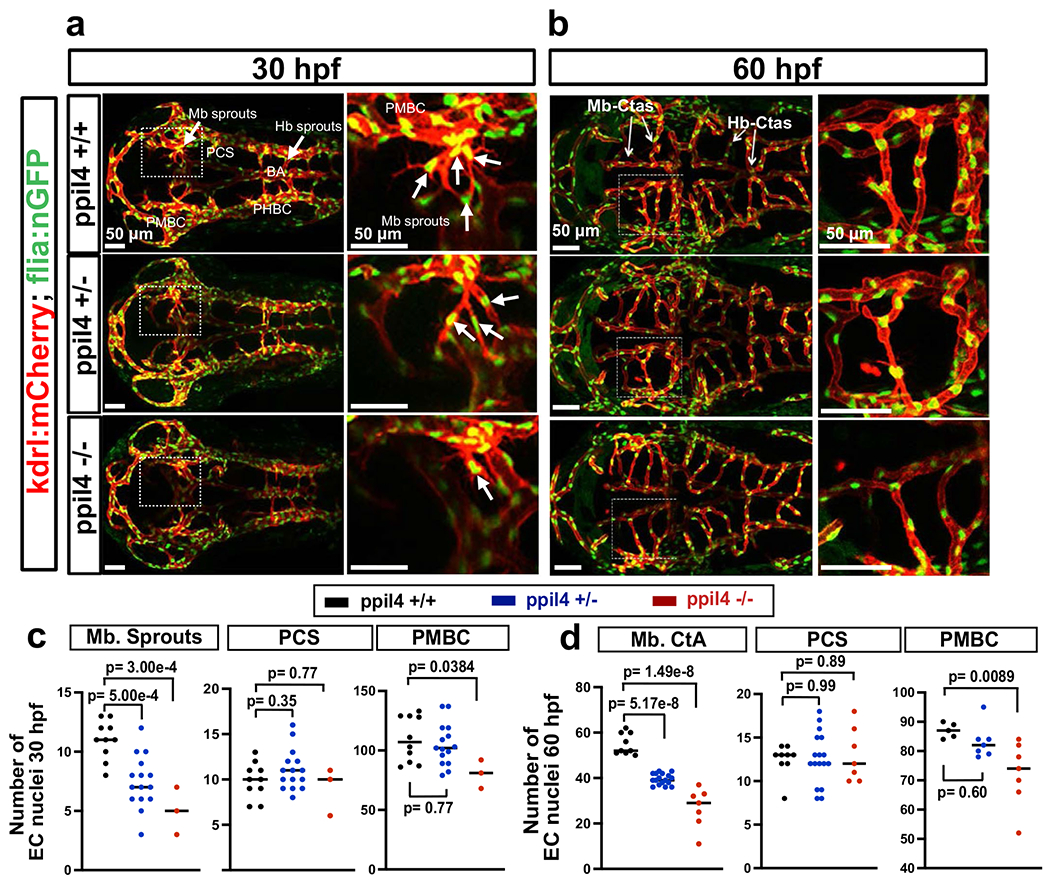
Extended Data Fig. 4 |. Loss of ppil4 results in reduction in endothelial cell number.

a,b, Confocal images of the cerebral vasculature of (a) 30 and (b) 60 hpf zebrafish in the tg(kdrl:mCherry; fli1:nGFP) background, expressing mCherry and GFP respectively in the cell membrane and nuclei of endothelial cells (ECs) (dorsal view). Arrows indicate angiogenic sprouting in midbrain (a), and hindbrain CtAs (b). c, Comparison of EC number at 30 hpf ppil4+/+ (n=10), ppil4+/− (n=15), and ppil4−/− (n=3) embryos. d, Comparison of EC number in the cerebral arteries of 60 hpf ppil4+/+ (n=9), ppil4+/− (n=17), and ppil4−/− (n=7) embryos. Individual values presented with scatter dot plot and median for all quantifications. Statistical tests: One-way ANOVA followed by Dunnett’s multiple comparison test for all comparisons. Abbreviations: Mb= Midbrain, Hb= Hindbrain, BA= Basilar Artery, PCS= Posterior communicating segment, PMBC= Primordial midbrain channel, PHBC= Primordial hindbrain channel, CtA= Central Artery. Scale bar: 50 μm in a and b.
