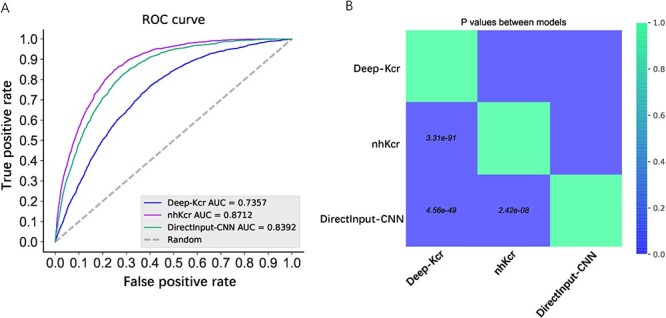
Figure 5 .

Performance comparison of the proposed nhKcr, the state-of-the-art predictor Deep-Kcr and the DirectInput-CNN. (A) ROC curves. Colored lines represent the different predictors. Diagonal gray dashed lines represent the performance of a random classifier. Legend box contains the AUC for each predictor. (B) pair-wise performance comparison between three methods in terms of P-value.
