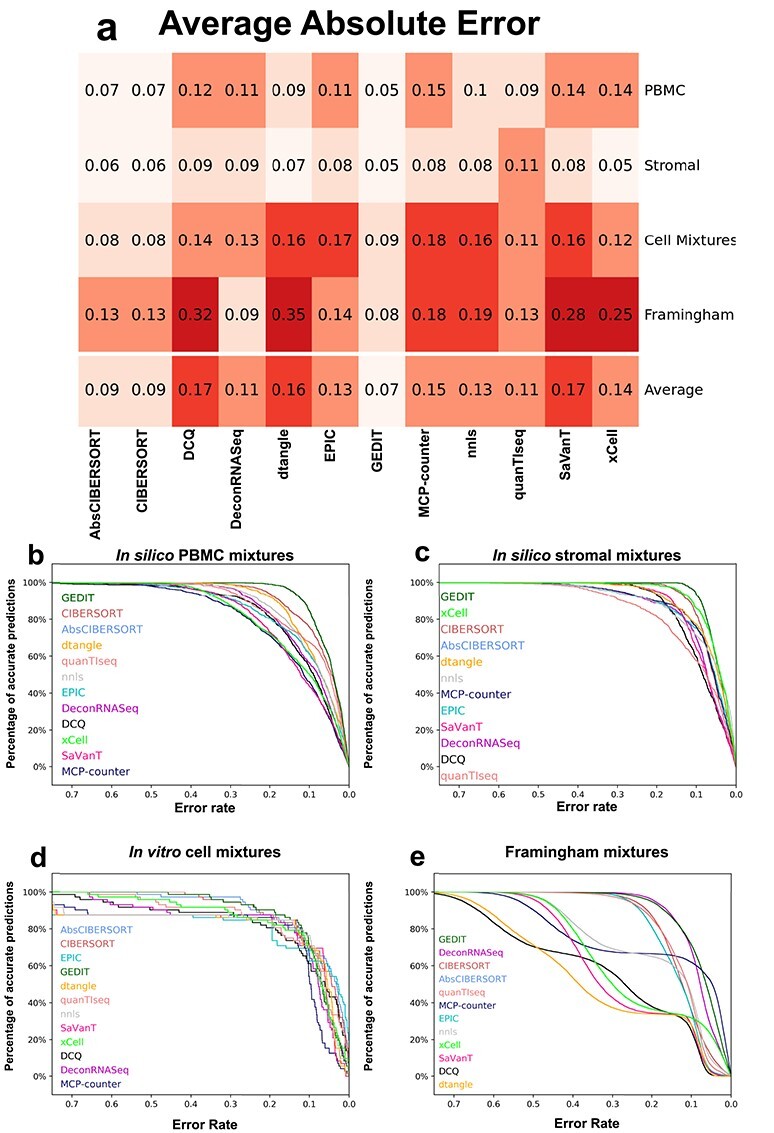
Figure 3 .

Error values of predictions for each tool and dataset. (A) Absolute error values, averaged across all predictions, for each tool and dataset. (B–E) Distribution of absolute error for all predictions in each dataset. Predictions are considered accurate (y-axis) if error is less than allowed error rate (x-axis). Legend is sorted by decreasing area under the curve (Supplementary Table S2). For each combination of tool and dataset, the reference producing the highest correlation value was used (Figure 1).
