Figure 3.
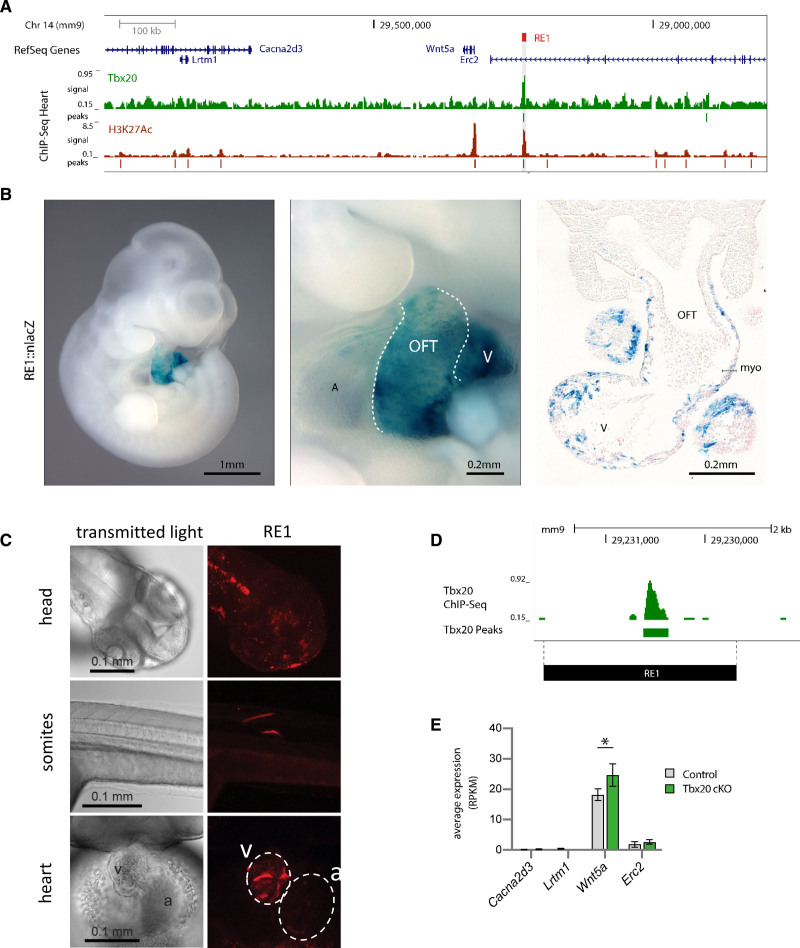
Characterization of RE1 in mouse and zebrafish. A, Genome browser view from the mouse orthologous Wnt5a genomic region. ChIP-seq tracks of TBX20 and H3K27Ac are displayed below. B, Representative embryos showing that RE1-lacZ reporter expression is observed in the developing murine heart, including outflow tract myocardium and ventricles. In total, 5 embryos were analyzed. A, atrium; V, ventricle; OFT, outflow tract. C, Representative image of 2dpf zebrafish showing RE1 activity in various organs and tissues, including the heart. In total, 296 embryos were analyzed. White dashed lines represent boundaries of ventricle and atrium. v: ventricle; a: atrium. D, TBX20 ChIP-Seq demonstrating RE1 to be bound by TBX20. E, Expression levels (average normalized read counts and SD) of Wnt5a and flanking genes in E11.5 FACS sorted cardiomyocytes from control (n=4) and cTnT-Cre;Tbx20 mutant murine hearts (n=4), *P=0.04, using limma38 adjusted for multiple testing using Benjamini-Hochberg correction.

