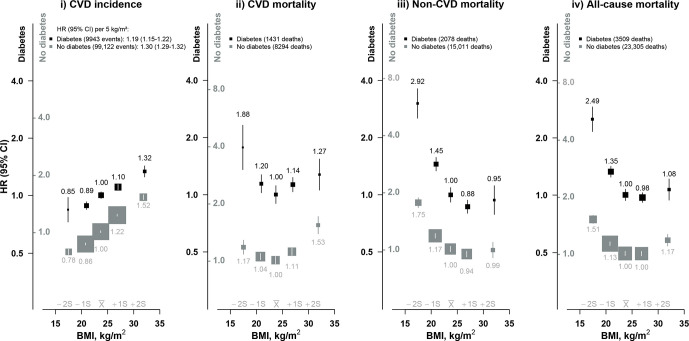
Figure 1.
Association of body mass index (BMI) with cardiovascular disease (CVD) incidence and CVD, non-CVD and all-cause mortality. HRs are stratified by age at risk, sex and study area, and adjusted for education, smoking, alcohol and physical activity. HRs are plotted on a floating absolute risk scale and separate y-axis scales were used for individuals with and without diabetes (black and gray labels, respectively). HRs are relative to 22.5–24.9 kg/m2 group, separately in individuals with and without diabetes. Each closed square represents HR with the area inversely proportional to the variance of the log HR. Vertical lines indicate 95% CIs. The x̅ above the x-axis represents the mean value of BMI in the full China Kadoorie Biobank population and the ±1S and ±2S represent 1 and 2 SD from the mean, respectively. The p value for trend test for CVD incidence regardless of diabetes status is <0.0001. The p value for trend test at BMI <25 kg/m2 for CVD mortality among individuals with diabetes is <0.0001 and among individuals without diabetes is 0.0004. The p value for trend test at BMI <25 kg/m2 for non-CVD and all-cause mortality outcomes regardless of diabetes status is <0.0001.

