Figure 5.
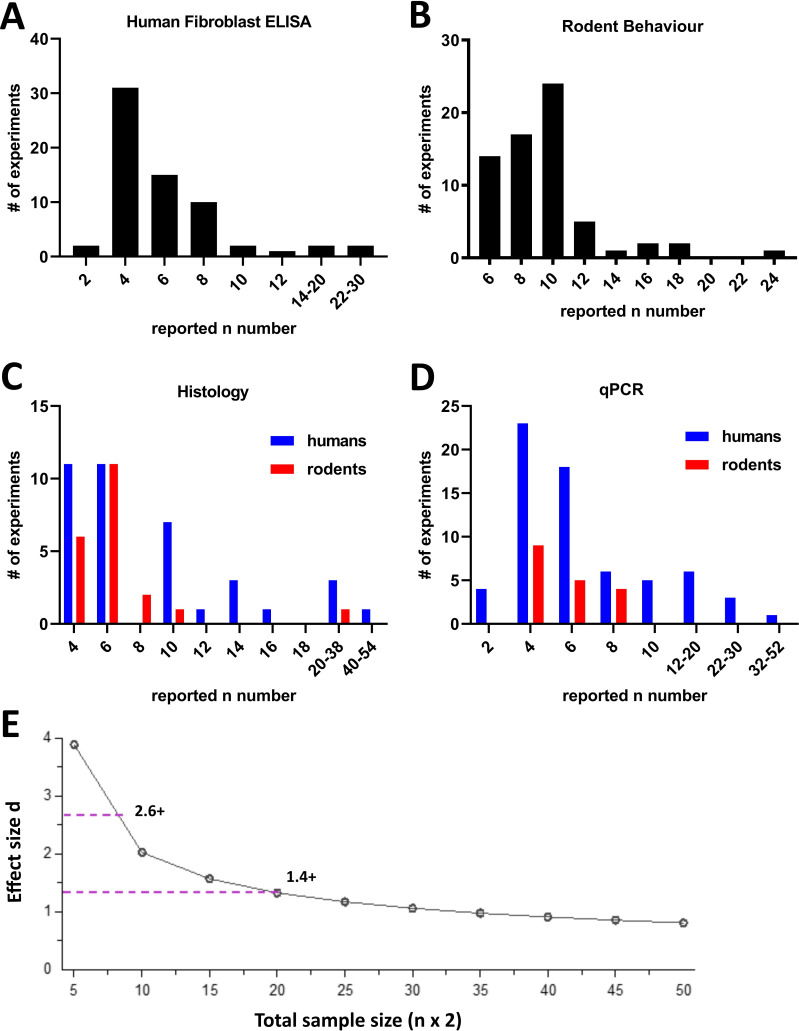
The majority of experiments were conducted with small n numbers. For the 403 experiments which reported n numbers, we plotted their distribution across the most commonly used experimental techniques: (A) human fibroblast ELISA, (B) rodent behavioural experiments, (C) histology in human or rodent tissue, and (D) qPCR with human or rodent samples. Odd numbers were counted in even number bins (eg, if n=3, it was counted in the n=4 group). Rodent groups include experiments using rats or mice. The Y axis shows the actual number of experiments in each category. (E) Sensitivity analysis for an independent samples t-test between two experimental groups with 5% alpha error probability and 80% power. Total sample size (eg, 10 for n=5) is plotted against effect size (Cohen’s d). The dotted lines indicate the minimum effect sizes one would be powered to detect under these conditions for commonly used n numbers: d=2.6 or above for n=4; d=1.4 or above for n=10. The plot was created using GPower Software. qPCR, quantitative PCR.

