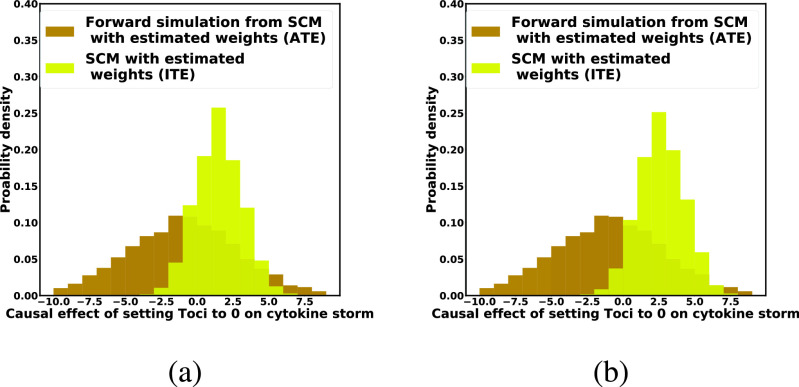
Fig. 10.
Case Study 2: SCM-Based estimates of the ATE and of the ITE using algorithm 3. Yellow histogram: the ITE estimated using counterfactual inference. Brown histogram: the ATE estimated using forward simulation. (a) Patient has a high viral load and received a low dose of Tocilizumab. (b) Patient has a low viral load and a received a high dose of Tocilizumab. Both patients were severely ill.

