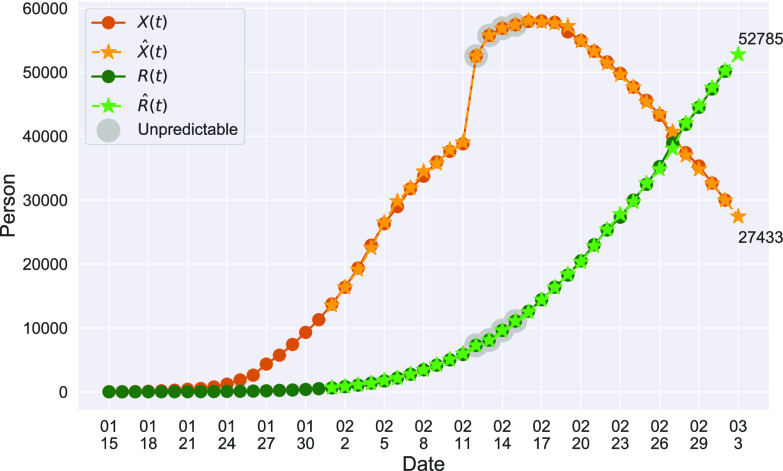
Fig. 4.
One-day prediction for the number of infected and recovered persons. The unpredictable points due to the change of definition of the confirmed case are marked as gray. The circle-marked solid curve with dark orange (resp. green) color is the real number of infected persons  (resp. recovered persons
  ), the star-marked dashed curve with light orange (resp. green) color is the predicted number of infected persons
  (resp. recovered persons
  ).
).

