
Figure 4.
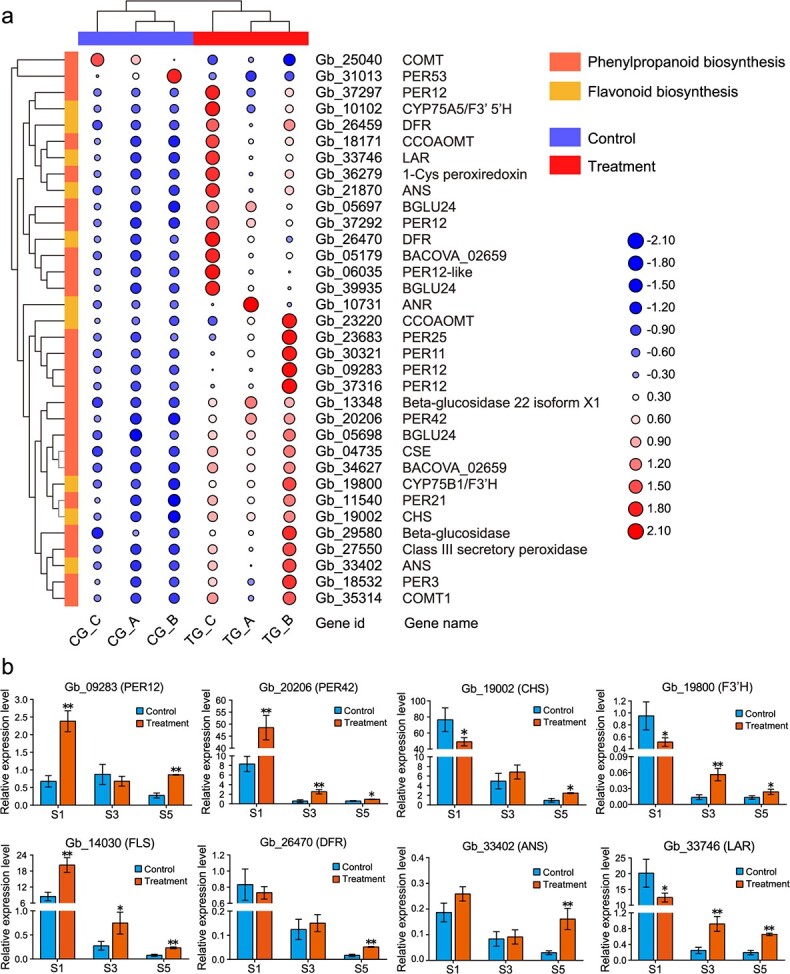
Differential expression of genes involved in secondary metabolite pathways in rejuvenated leaves. a Hierarchical clustering heatmap of differentially expressed genes related to phenylpropanoid biosynthesis and flavonoid biosynthesis. The value matrix is indicated by both the continuous color scheme and the circle size. The expression values in a row are normalized. The original numbers of fragments per kilobase of transcript per million mapped reads are displayed in the corresponding circles. b Results of a qRT–PCR analysis of the expression profiles of eight candidate genes involved in phenylpropanoid (PER12, PER42) and flavonoid biosynthesis (DFR, F3’H, ANS, LAR, FLS, and CHS) in S1, S3 and S5. The data are the means ± SDs of relative expression levels (n = 3). * and ** indicate significant differences from the controls at p < 0.05 and p < 0.01, respectively, as determined by Student’s t-test. ANS, ANTHOCYANIDIN SYNTHASE; CHS, CHALCONE SYNTHASE; DFR, DIHYDROFLAVONOL 4-REDUCTASE; F3′H, FLAVONOID 3′-HYDROXYLASE; FLS, FLAVONOL SYNTHASE; LAR, LEUCOANTHOCYANIDIN REDUCTASE; PER12, PEROXIDASE 12; PER42, PEROXIDASE 42.