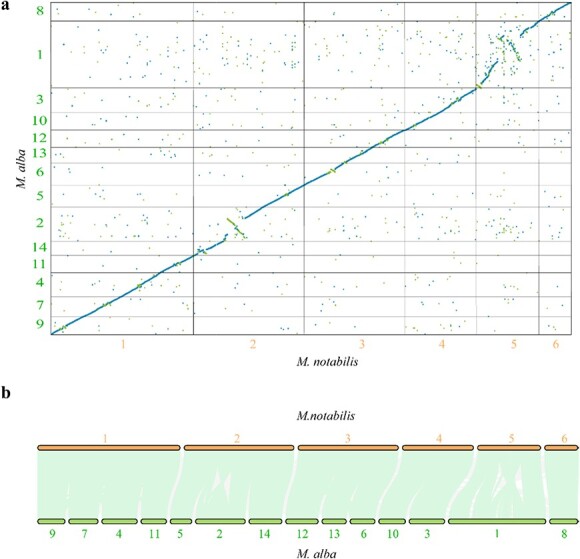
Figure 2.

Chromosome rearrangement and gene collinearity analysis between M. notabilis and M. alba. (a) Large-scale genome alignment and comparison of M. notabilis and M. alba ‘Heyebai’. The x-axis denotes the six chromosomes of M. notabilis. The y-axis represents the 14 chromosomes of M. alba ‘Heyebai’. The minimum alignment length displayed was set at 1000 bp. Blue dots denote unique forward alignments. Green dots denote unique reverse alignments. (b) The collinearity of genes between M. notabilis and M. alba. The light green lines represent all collinear genes in the corresponding chromosomes. The gray lines represent other collinear genes. Bold font in orange or dark green denotes the corresponding chromosomes in M. notabilis and M. alba, respectively.
