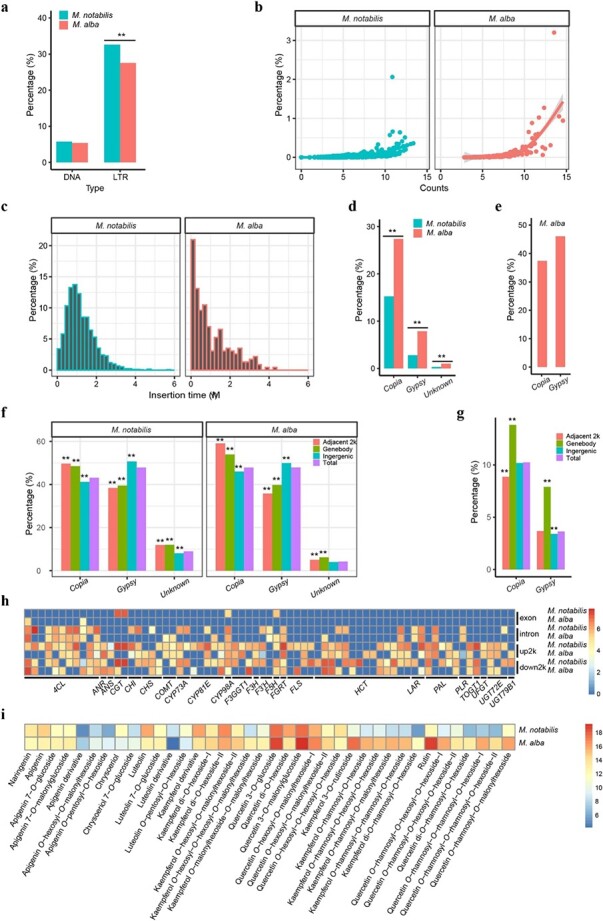
Figure 5.

Comparative analysis of long terminal repeats (LTRs) in the genomes of M. notabilis and M. alba. Comparison of DNA and LTR TE proportions between the two genomes. **P < 0.01 (a). Comparison of the copy numbers and proportions of each LTR in the two genomes. The counts of each element indicate the number of element fragments in the genome. The x-axis values were log2 transformed. The y-axis denotes the proportion of each element in the genome. The best-fit regression lines are shown (b). Insertion time distribution and amplification of LTR TEs in the M. notabilis and M. alba genomes. The width of the insertion time bins was 0.2 MYA. The x-axis denotes the insertion times of all full-length LTRs. The values on the y-axis represent the proportion of elements per time interval (c). Proportions and comparison of LTRs belonging to the same families between the two genomes. The proportion of each superfamily was calculated based on the total length of the same family elements of the superfamily/the total length of the elements of the superfamily. **P < 0.01 (d). Proportion of rearranged Copia and Gypsy elements in the M. alba genome. The bars denote the proportion of the corresponding superfamily, which was calculated from the total length of the rearranged elements of the superfamily/total length of the same family elements in the M. alba genome (e). Genome-wide distribution patterns of LTR TEs within and around genes between the two mulberry genomes. The genomes were classified into three regions: gene body regions, adjacent 2 kb upstream and downstream regions, and intergenic regions. The bars denote the proportions of the corresponding superfamily elements in the aforementioned regions. The proportions of superfamily elements within these regions were compared with those in the genome. **P < 0.01 (f). Genome-wide distribution patterns of rearranged LTR TEs in the M. alba genome. The genome was also classified into three regions: gene body regions, adjacent 2 kb upstream and downstream regions, and intergenic regions. The proportions of rearranged superfamily elements within those regions were compared with those in the genome. **P < 0.01 (g). LTRs were located in the gene body or adjacent 2 kb upstream and downstream regions of 71 flavonoid biosynthesis pathway-related genes. Columns in the heatmap represent genes. Rows in the heatmap represent regions of the genes. The number displayed near the color scale indicates the length (log2 transformed) of LTRs in the corresponding area (h). Summary of the differences in flavonoid metabolite content between M. notabilis and M. alba. Columns in the heatmap represent concentrations of flavonoid metabolites. Rows in the heatmap represent the two mulberry species. The color bar denotes the concentrations (log2 transformed) of flavonoid metabolites in the two mulberry species (i).
