
Figure 6. The amino acid resolution binding site information allows accurate predictions of functional effects of disease mutations and PTMs.
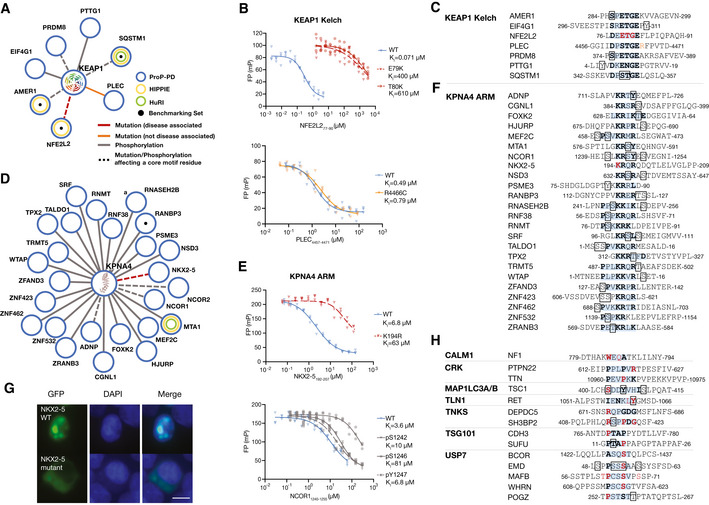
- PPI networks of KEAP1 showing reproducibly selected high/medium confidence interactions with mutations or phosphosites overlapping with the binding motif or in the flanking regions (± 2 residues).The disease‐associated mutation is colored in red (orange if not disease associated). Phosphosites are colored in gray. Dashed‐edges represent mutations or phosphosites in motif residues.
- FP competition experiments of wild‐type and disease mutant peptides binding to KEAP1 Kelch using FITC‐NFE2L1228–243 as probe (n = 3, technical replicates, shown are individual data points. Source data are provided).
- Peptide sequences related to the interactions shown in panel (A).
- PPI networks of KPNA4 showing reproducibly selected high/medium confidence interactions with mutations or phosphosites overlapping with the binding motif or in the flanking regions (± 2 residues).
- FP competition experiments of wild‐type, disease mutant, and phospho‐peptides binding to KPNA4. The affinities of NXK2‐5 wild‐type and K194R mutant for KPNA4 were determined using FITC‐Myc320–328 as a probe; the affinities of unphosphorylated and phosphorylated NCOR2 peptides were determined using FITC‐NCOR21307–1322 as probe (n = 3, technical replicates, shown are individual data points. Source data is provided).
- Peptide sequences related to the interactions shown in panel (D).
- Representative cellular localization experiments of the GFP‐based NLS sensor fused to wild‐type or K194R mutant NKX2‐5192–207 peptide. HEK293 cells were transiently transfected with the NLS sensor and fixed 36 h after transfection, and imaged using epifluorescence microscopy. The nucleus was stained with DAPI. The scale bar indicates 10 μm (n = 3, independent experiments).
- Peptides for additional baits with disease‐associated mutations in the consensus binding motif.
Data information: For (C), (F) and (H): Motifs are highlighted with blue background and key residues are indicated in bold letters, phosphosites are indicated by a box, and disease‐associated mutations of SLiMs are indicated in red bold letters.
Source data are available online for this figure.