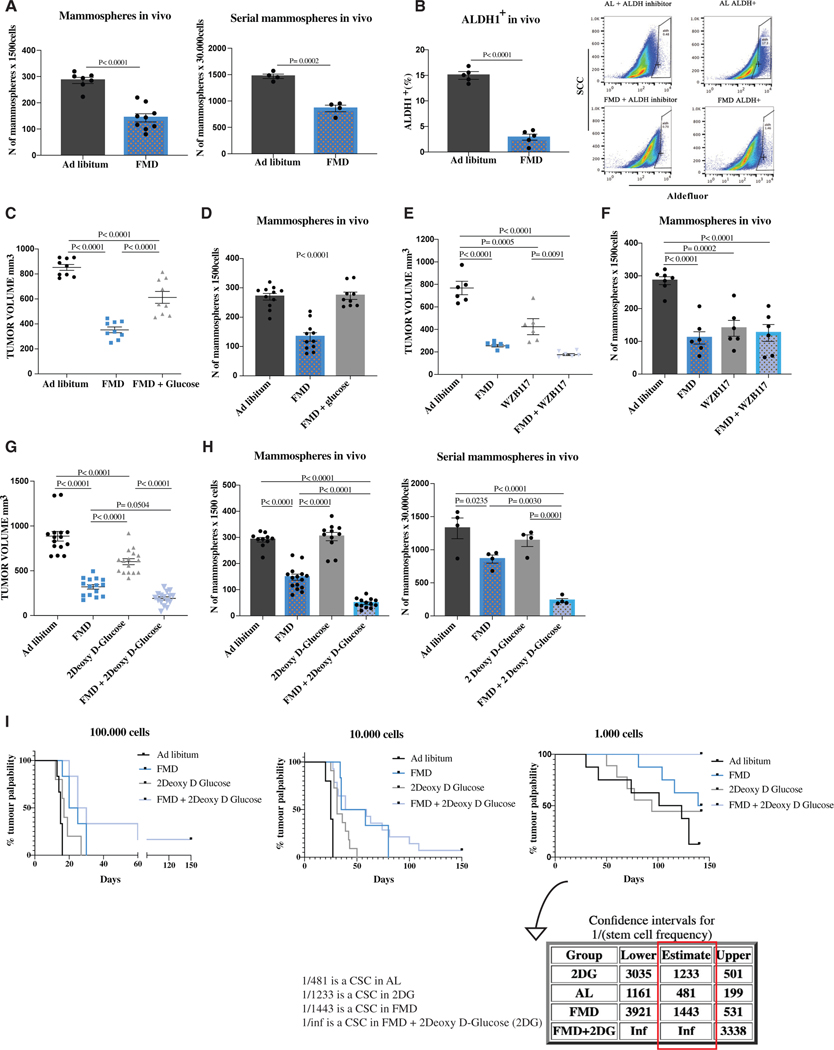
Figure 1. FMD reduces mammosphere growth, the expression of CSC markers, and stem cell frequency in SUM159 human triple-negative breast cancer (TNBC), and its effect is potentiated by 2-deoxy-D-glucose.
(A) SUM159 tumor masses were processed for ex vivo primary mammosphere (n = 7–9) and ex vivo serial sphere-forming assay (n = 4).
(B) Aldefluor analyses were performed by flow cytometry using the ALDEFLUOR kit to measure ALDH1 expression in SUM159 tumor masses (n = 5).
(C) Growth of SUM159 xenografts in 8-week-old female NOD scid (NSG) mice treated with AL diet or 5 cycles of FMD alone or plus 3% glucose supplementation in drinking water (n = 9).
(D) Tumor masses were excised and processed for ex vivo primary mammosphere assay (n = 9).
(E) Growth of SUM159 xenografts in 8-week-old female NOD scid (NSG) mice treated with AL diet or 5 cycles of FMD alone or combined with WZB117 (10 mg/kg) once a day intraperitoneally (i.p.) (n = 6).
(F) Tumor masses were excised and processed for ex vivo primary mammosphere assay (n = 6).
(G) Growth of SUM159 xenografts in 8-week-old female NOD scid (NSG) mice treated with AL diet or 5 cycles of FMD alone or combined with 2DG (200 mg/kg) once a day i.p. (n = 15).
(H) Tumor masses were excised and processed for ex vivo primary mammosphere assay (n = 10–15) and serial mammosphere assay (n = 5).
(I) SUM159 tumor cells derived from in vivo xenografts were injected in recipient mice at different dilutions to perform the limiting dilution assay (n = 6–14). p values were determined by log-rank (Mantel-Cox)test (100,000 cells: ad libitum versus FMD, p =0.0024; ad libitum versus 2DG, p = 0.0660; ad libitum versus FMD + 2DG, p = 0.0008; FMD versus 2DG, p = 0.1007; FMD versus FMD + 2DG, p = 0.1657; 2DG versus FMD + 2DG, p = 0.0177; 10,000 cells: ad libitum versus FMD, p = 0.0011; ad libitum versus 2DG, p = 0.0003; ad libitum versus FMD + 2DG, p < 0.0001; FMD versus 2DG, p = 0.0428; FMD versus FMD + 2DG, p = 0.3120; 2DG versus FMD + 2DG, p = 0.0192; 1,000 cells: ad libitum versus FMD, p = 0.0891; ad libitum versus 2DG, p = 0.3981; ad libitum versus FMD + 2DG, p = 0.0001; FMD versus 2DG, p = 0.4714; FMD versus FMD + 2DG, p = 0.0123; 2DG versus FMD + 2DG, p = 0.0067). The stem cell frequency was calculated using ELDA software. Data are represented as mean ± SEM. p values were determined by two-tailed unpaired t test (A and B) and one-way ANOVA (C–H). See also Figures S1 and S2.

