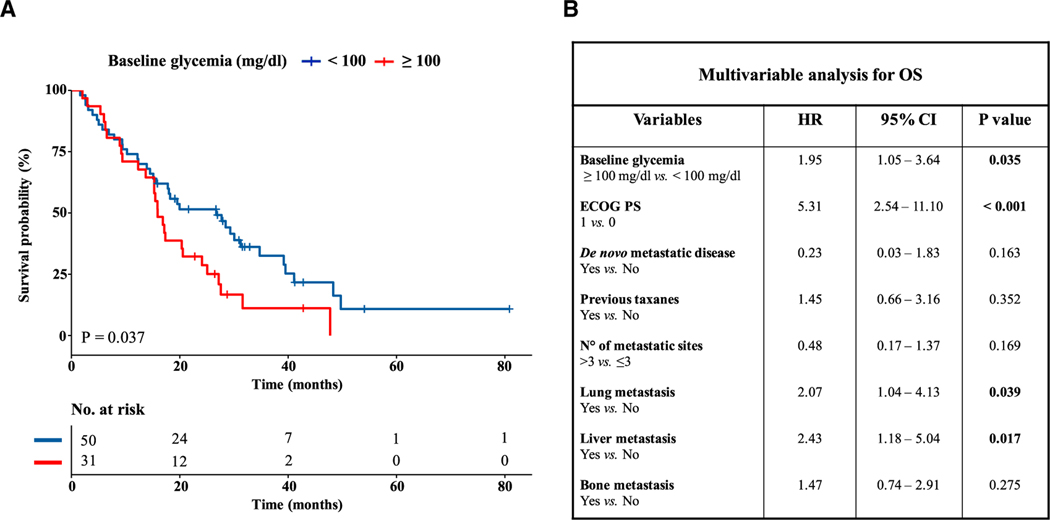
Figure 3. Hyperglycemia is associated with worse overall survival in advanced TNBC patients.
(A) Kaplan-Meier curves for overall survival (OS) according to baseline blood glucose levels in advanced TNBC patients treated with first-line platinum-based doublet chemotherapy. Normoglycemia and hyperglycemia were defined according to 100 mg/dL threshold. The + symbol in Kaplan Meier curves indicates patients who were censored at the time of data cut-off analysis.
(B) Multivariable analysis adjusting the impact of hyperglycemia on OS according to clinical characteristics previously selected on the basis of univariate analysis. For each covariate the hazard ratio (HR), 95% confidence interval (CI), and p value are indicated. CIs not crossing the value of 1 indicate a statistically significant impact of that variable on patient OS. The p value is indicated in bold when statistically significant.
See also Figure S4.

