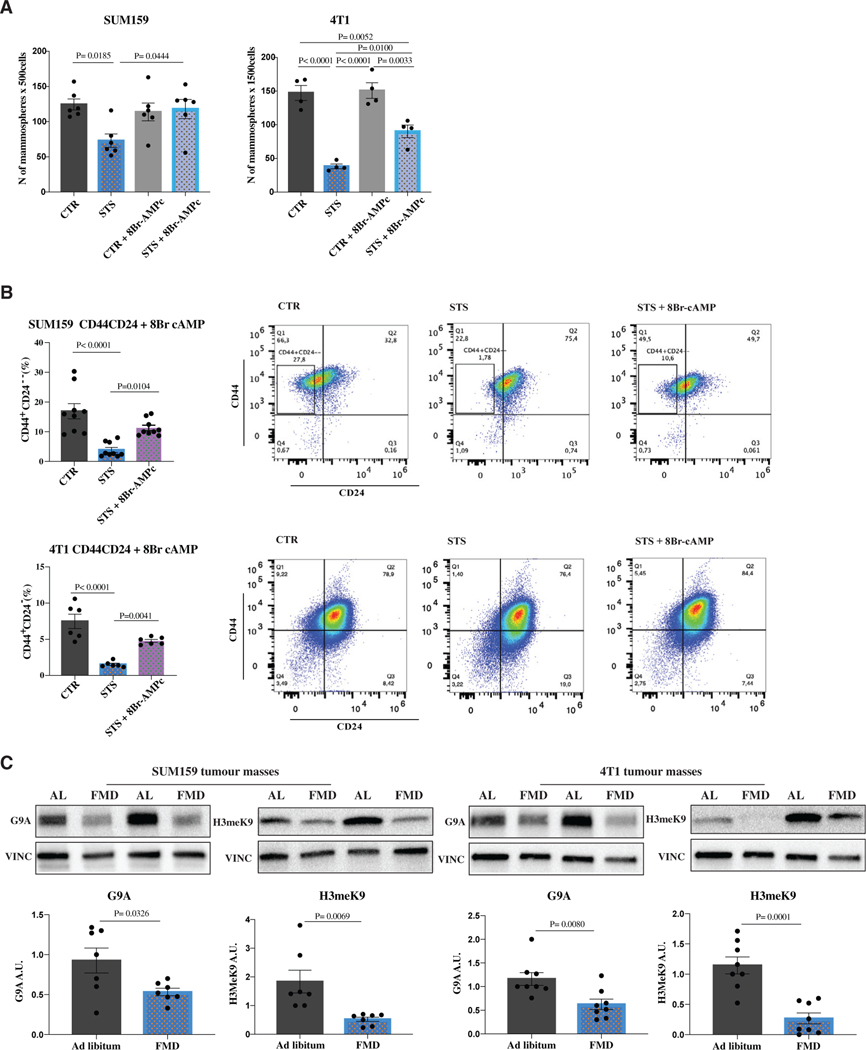
Figure 5. PKA activation through 8Br-cAMP reverses STS-dependent sphere reduction and CD44+CD24– cell lowering.
(A and B) SUM159 and 4T1 cells were grown under CTR (1 g/L glucose, 10% FBS) and STS (0.5 g/L, 1% FBS) conditions for a total of 48 h. At 24 h cells were treated with 8-Br-cAMP. Cells (A) were then plated to perform the in vitro sphere-forming assay (n = 4–6 biological replicates) or (B) were used to perform flow cytometry analysis to measure the percentage of CD44+CD24+ and CD44+CD24– cells in SUM159 or 4T1 TNBC models (n = 6–9 biological replicates).
(C) Detection of G9A, H3meK9 levels, and VINCULIN, as loading control, in SUM159 and 4T1 tumors (n = 7–8).
Data are represented as mean ± SEM. p values were determined by two-tailed unpaired t test (C) and one-way ANOVA (A and B).

